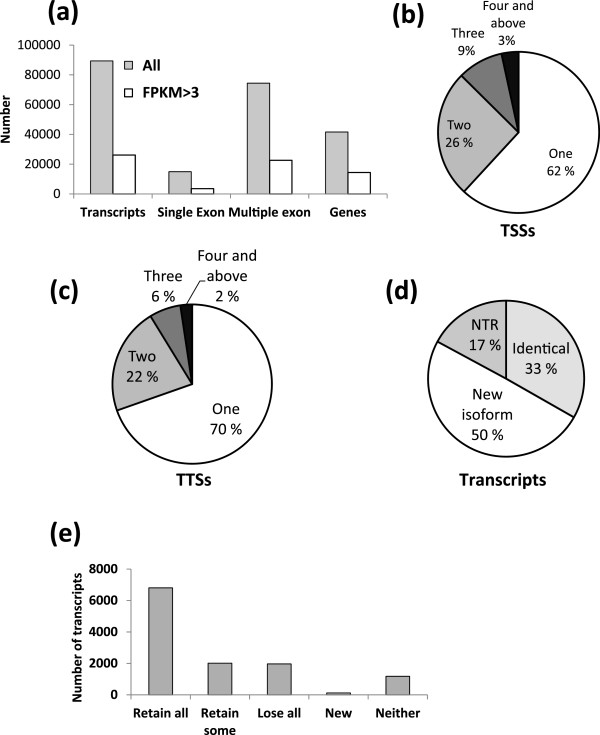
Figure 2.
Characterization of the pre-ZGA and post-ZGA embryo transcriptomes. (a) Number of genes, transcripts and transcripts with one or more exons in the all and FPKM > 3 datasets. (b) Percentages of loci with 1, 2, 3 or more TSSs. (c) Percentages of loci with 1, 2, 3 or more TTSs. (d) Percentage of isoforms classified as NTR, identical (known) or new in the FPKM > 3 dataset. (e) Difference between the novel and annotated transcripts on functional domain(s) content. Most novel isoforms had retained all functional domains as compared to their closest matching annotated counterpart.

