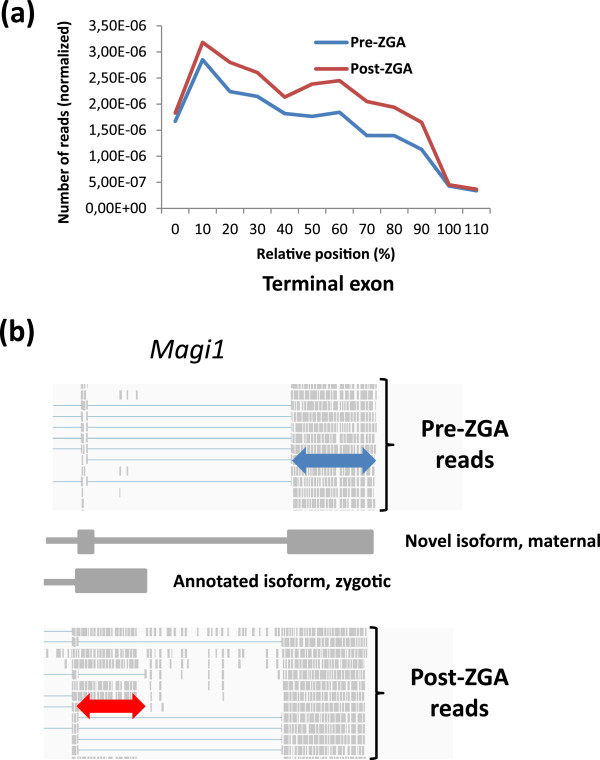
Figure 6.
Extended 3’ terminal exons and alternative last exons. (a) Metagene representation of RNA-seq reads for the last exon in a set of transcripts detected with more coverage in the proximal half of the terminal exon post-ZGA (red line) as compared to pre-ZGA (blue line). X-axis is in percentage of total length and Y-axis is number of reads normalized against total number of reads in the samples. (b) The gene magi1 displays a change in the expression of its isoforms pre- and post-ZGA with an alternative 3’UTR appearing post-ZGA (red double-arrow). Prior to the ZGA a novel isoform is expressed (blue double-arrow). This isoform is expressed also after the MBT but then together with the novel isoform.

