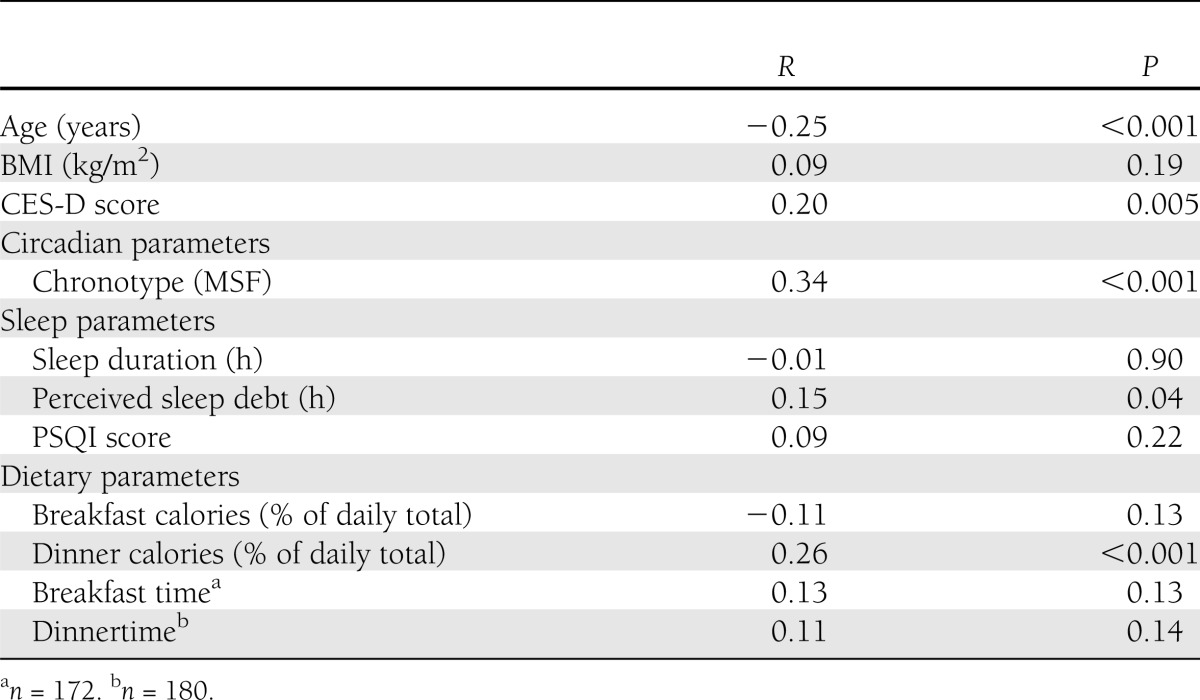
Table 2.
Pearson correlation (r) between demographics and circadian, sleep, and dietary parameters and natural log of HbA1c (n = 194 unless otherwise noted)

Pearson correlation (r) between demographics and circadian, sleep, and dietary parameters and natural log of HbA1c (n = 194 unless otherwise noted)
