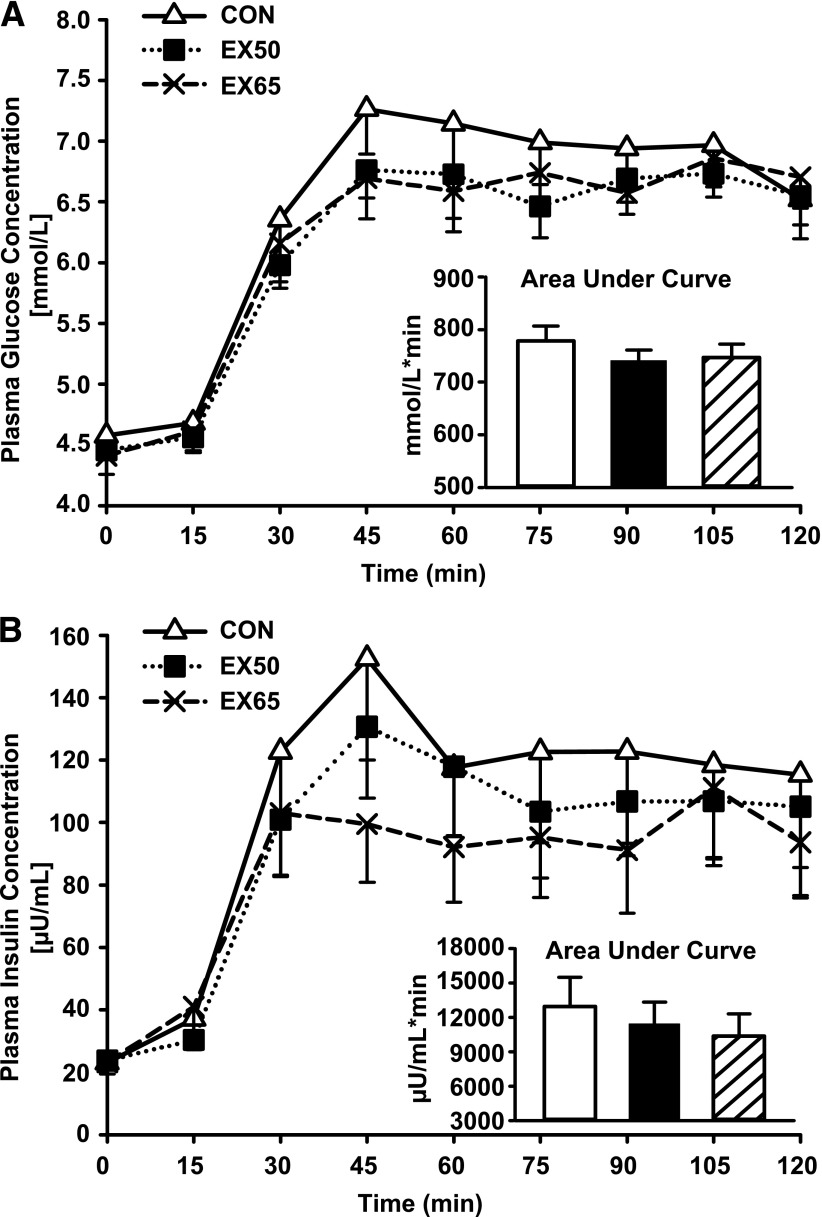
Figure 2.
Plasma concentrations of glucose (A) and insulin (B) measured during the meal tolerance test conducted 1 h after exercise or remaining sedentary. Inset figures are calculated as mean area under the plasma concentration curve for each trial. A: For plasma glucose concentration, the two-way (treatment × time) repeated-measures ANOVA, P = 0.17, and the main effect AUC, one-way repeated-measures ANOVA, P = 0.09. B: For plasma insulin concentration, the two-way (treatment × time) repeated-measures ANOVA, P = 0.15, and the main effect AUC, one-way repeated-measures ANOVA, P = 0.07.

