Figure 2.
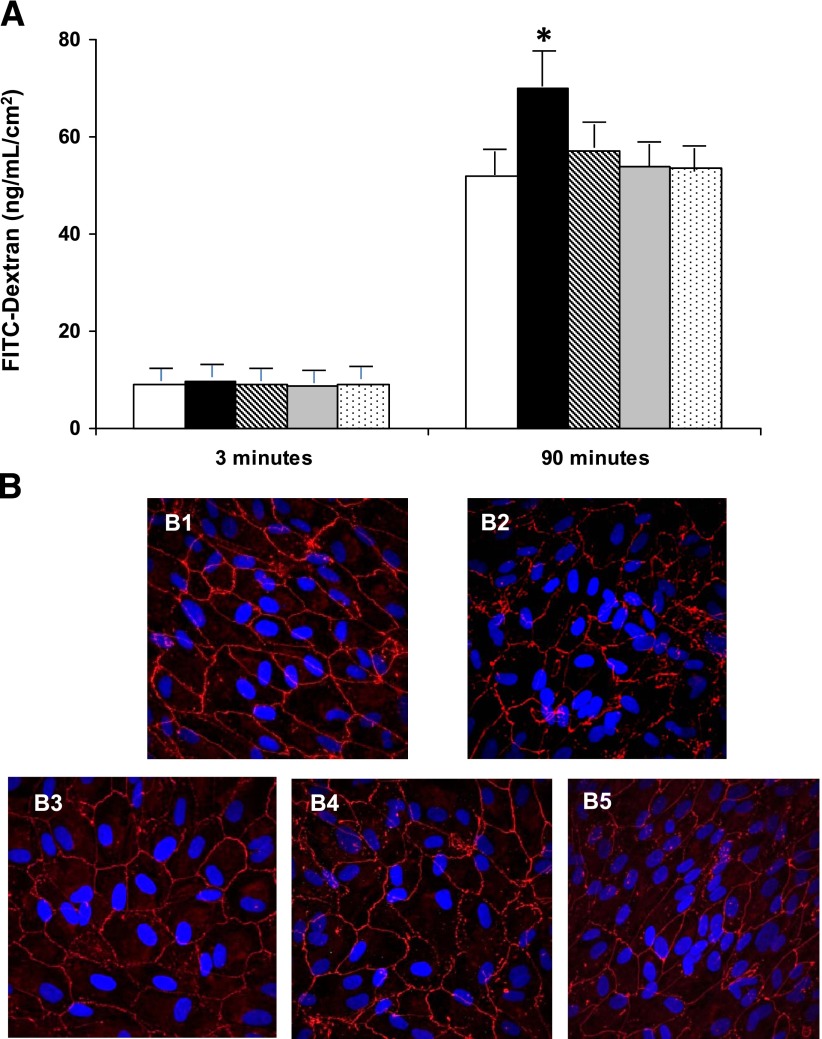
A: Results of 70 kDa dextran permeability in ARPE-19 cells cultured under 25 mmol/L d-glucose in the different conditions examined. The vertical axis is the concentration of dextran. Dextran permeability was measured at 3 and 90 min. Empty bars, control condition (25 mmol/L d-glucose); black bars, hemopexin (50 µg/mL); gray bars, hemopexin after anti-hemopexin antibody (0.75 µg/mL) obtained from goat; stripped bars, hemopexin after anti-hemopexin antibody (0.75 µg/mL) obtained from rabbit; dotted bars, hemopexin after anti-hemopexin antibody (0.75 µg/mL) obtained from mouse. Results are expressed as means; n = 4. *P < 0.05 in comparison with hemopexin treatment. B: Immunofluorescence images obtained by confocal microscopy showing the ARPE-19 monolayer. B1: Immunostaining for ZO-1 (red) in cells cultured under 25 mmol/L d-glucose showing a well-structured monolayer. B2: Disorganization of ZO-1 and breakdown of ARPE-19 monolayer induced by hemopexin. B3–B5: Prevention of the disruption of ARPE-19 monolayer with anti-hemopexin antibodies before hemopexin treatment. Nuclei stained with DAPI (blue). Bar: 10 μm. FITC, fluorescein isothiocyanate.

