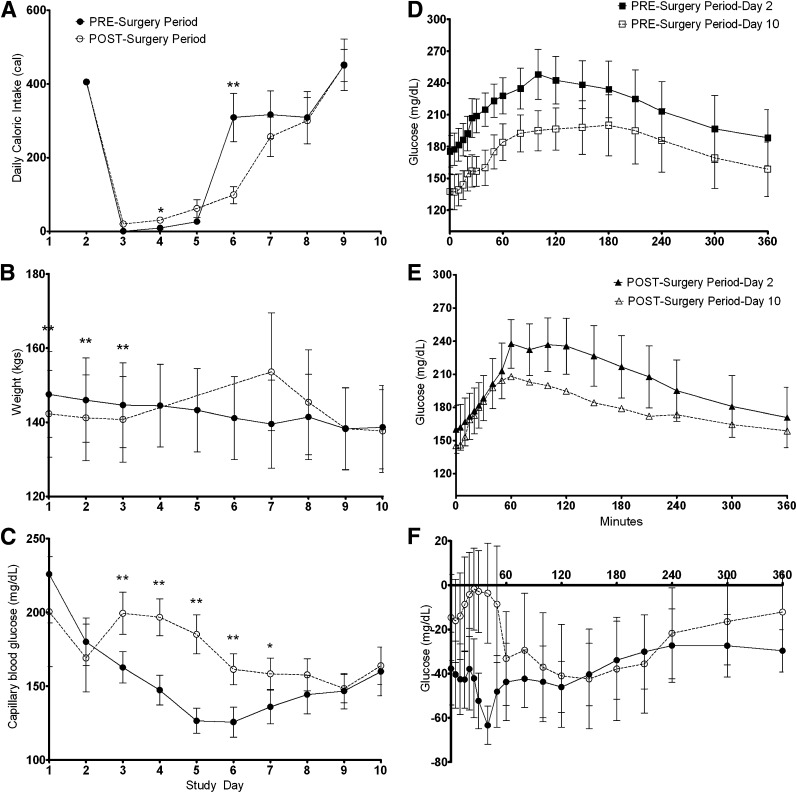
Figure 2.
Comparison of the changes observed during the presurgery period and postsurgery period. A: Daily caloric intake (calories). B: Daily weight (kg). C: Daily average capillary blood glucose (mg/dL). D: The improvement in the glucose profile over a 6-h MMCT in the presurgery period. E: The improvement in the glucose profile over a 6-h MMCT in the postsurgery period. F: The change in glucose (delta) for each time point during the MMCT within each study period. Data are mean and SE. Continuous line with filled circles (●) indicates presurgery period; dotted line with open circles (○) indicates postsurgery period; continuous line with filled squares (■) indicates baseline testing in presurgery period; dotted line with open squares () indicates end of period testing in presurgery period; continuous line with filled triangles (▲) indicates baseline testing in postsurgery period; dotted line with open triangles (▵) indicates end of period testing in postsurgery period. *P < 0.05; **P < 0.01.

