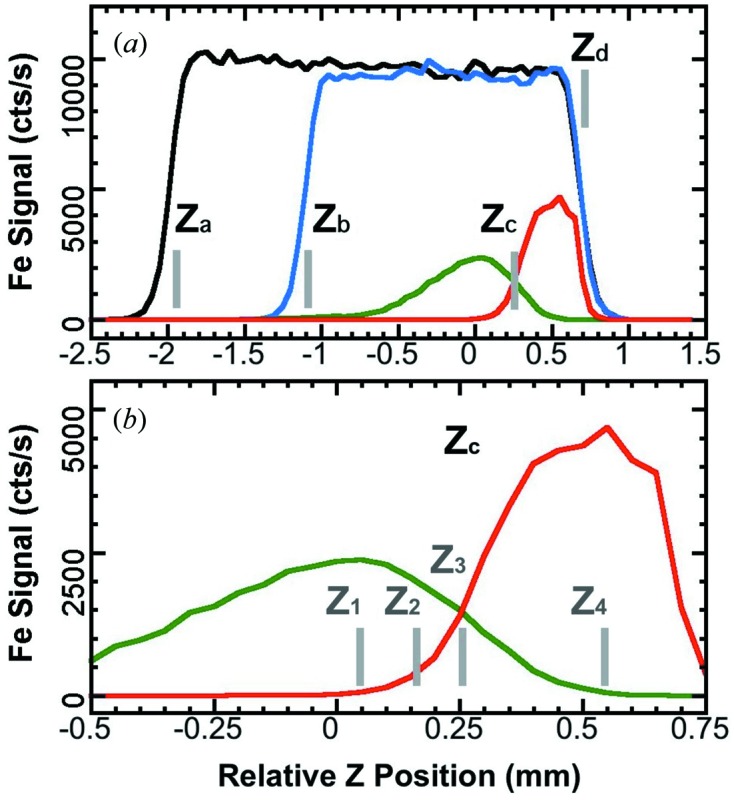
Figure 2.

(a) Fe NRVS signal at B (black, blue and red) versus the relative beam positions (Z): the black curve is for an empty cryostat base; the blue is for an empty sample holder; the red is for a real sample ([Fe4S4Cl4]=) at A. Letters Z a, Z b, Z c and Z d indicate the cut-off at the cryostat base, sample holder’s inner bottom, sample’s top surface and vacuum chamber’s top window, respectively. (b) Blow-up of (a). The bars Z 1, Z 2, Z 3 and Z 4 are several possible choices for an in situ calibration. The green line represents the [Fe4S4Cl4]= NRVS signal at A.
