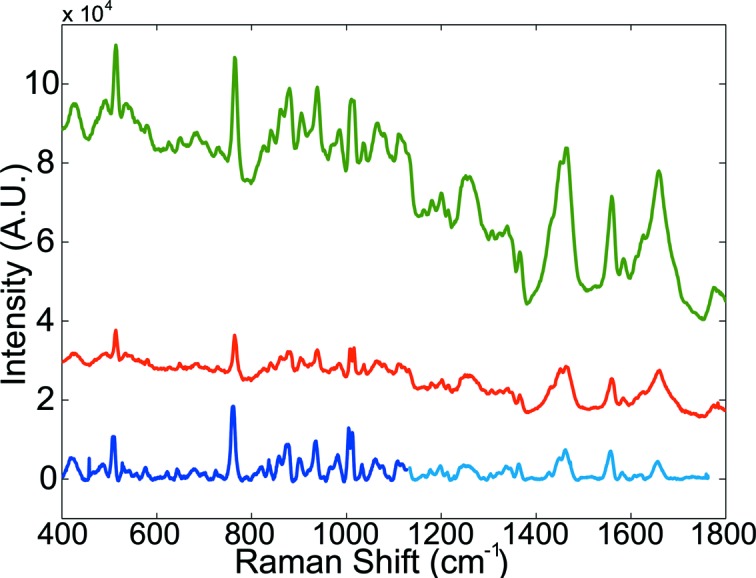
Figure 7.

Non-resonance Raman spectra of a HEWL crystal using different grating and slit settings. Green: 600 lines mm−1 grating, 100 µm slit size with 100 s acquisition time; red: 600 lines mm−1 grating, 10 µm slit size and 240 s acquisition time; blue: 1200 lines mm−1 grating, 100 µm slit size with 180 s acquisition time. Spectra were acquired with excitation at 785 nm. The last spectrum was manually stitched together from two separate acquisitions (400–1120 cm−1 and 1040–1760 cm−1) to extend to a comparable spectral range. For this spectrum a basic baseline correction was applied. All other spectra show raw data. Power at the sample was 160 mW.
