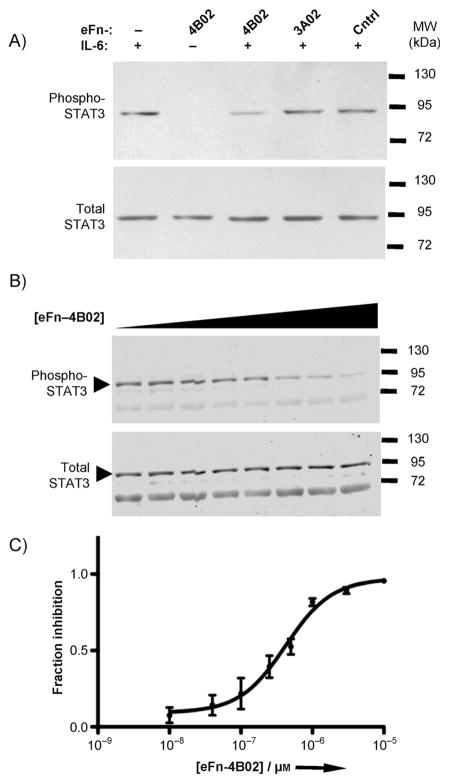
Figure 3.
Inhibition of IL-6 function. IL-6 signaling inhibition was assayed by western blot for STAT3 phosphorylation at Y705. A) IL-6 (50 ngmL−1) was added to HuH-7 cells pre-incubated with 500 nM of various e10Fn3s for 12 min. B) Quantitative western blot to determine concentration-dependent inhibition; imaged using an infrared dyelabeled secondary antibody. Shown is one of three independent experiments. eFn-4B02 (10 nM−10 μM) and IL-6 (10 ngmL−1) were pre-incubated for 30 min before applying to HuH-7 cells for 12 min. C) Four-parameter nonlinear regression curve fit of quantitative western blot analysis (IC50 = 422 nM).

