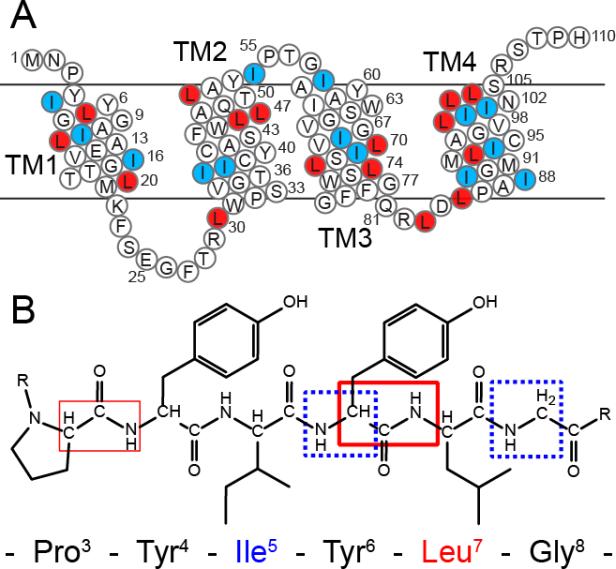
Figure 1.
Primary sequence of EmrE with the reverse labels that will act as filters in the spectroscopic approaches highlighted. (A) Sequence of EmrE with white circles highlighting [U-13C,15N] labeled residues, red circles indicating [15N-Leu] residues, and blue circles showing Ile residues labeled at natural abundance. (B) The afterglow NCOCX is expected to give strong peaks for residues preceding Leu (thick red box) with weaker signals for the other spin systems within the protein (thinner red box). The FDR experiment gives a filtered NCA correlation spectrum, where only residues appearing after the unlabeled residue give rise to peaks in an NCA spectrum (dotted-blue boxes).

