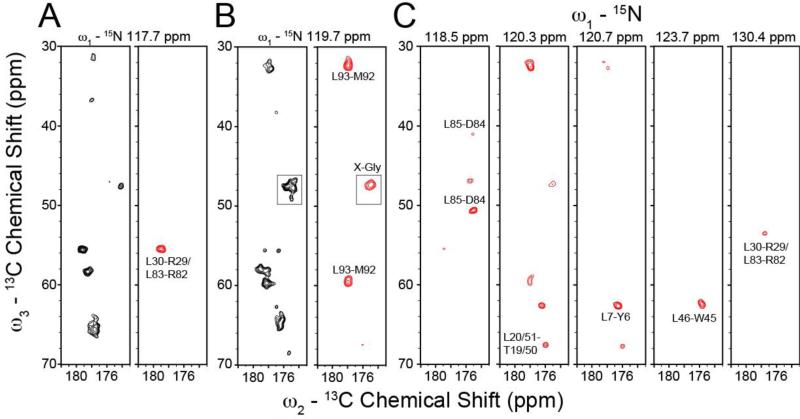
Figure 3.
Comparison of standard and afterglow NCOCX experiments applied to [U-13C,15N] and RevIL, respectively. The afterglow approach is used as an isotopic filter to aide in the assignment of EmrE. (A, B) Strip plots from the standard 3D NCOCX acquired using [U-13C,15N] EmrE (black peaks) and the afterglow 3D NCOCX spectrum acquired on RevIL EmrE (red peaks). Note that the afterglow 3D NCOCX was acquired with 18 msec DARR and after an NCACX experiment with 50 msec DARR. Only Leu-X spin-systems were observed in the afterglow dataset with the exception of one Gly-X peak shown in panel B (boxed region; due to overlapping resonances). At a lower contour level, the Gly-X region in the boxed region appears the same as the standard NCOCX on [U-13C,15N] EmrE. (C) Additional strip plots from the 3D NCOCX afterglow dataset on RevIL EmrE. The standard NCOCX strips are plotted at 6.3σ and the afterglow NCOCX is shown at 6.6σ.

