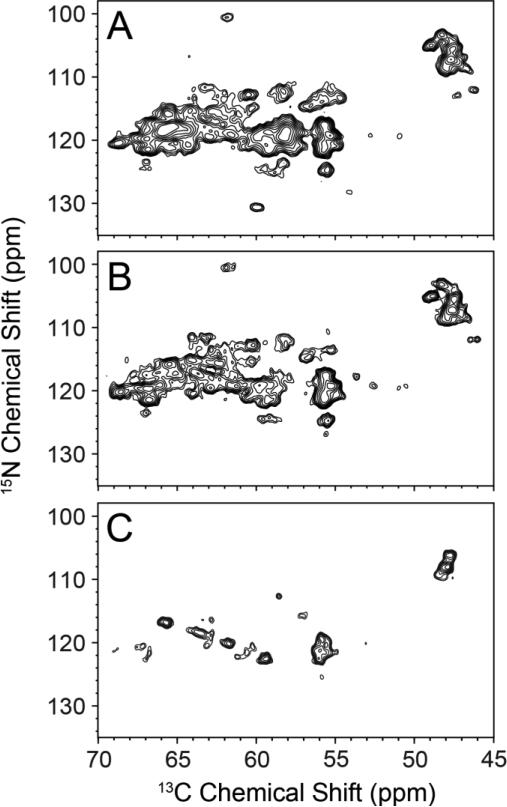
Figure 4.
Resolution improvement for EmrE using the reverse labeling approach in conjunction with 2D FDR-NCA experiments. (A) [U-13C,15N] EmrE standard NCA 2D dataset using SPECIFIC-CP (same as in Figure 2). (B) RevIL EmrE standard NCA 2D dataset using SPECIFIC-CP and acquired in a similar manner as that in panel A. (C) FDR-NCA spectrum of RevIL EmrE. The spectrum in panel C shows only peaks for residues immediately following Ile and Leu in the primary sequence. Panels A, B, and C are plotted at 7.1σ, 5.8σ, and 7.0σ, respectively.

