
Fig. 3.
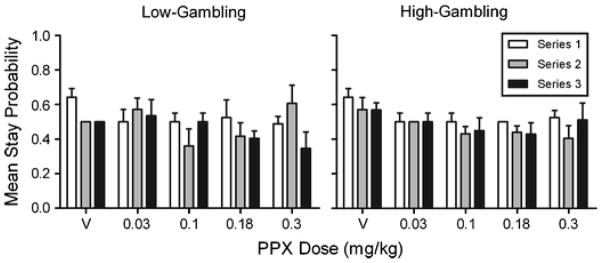
Group mean conditional probabilities of making the first free-choice on the lever that ended the series of forced-choice trials (i.e., response perseveration) in low- (left graph) and high-gambling (right graph) baseline conditions. Conditional probabilities are plotted as a function of pramipexole dose with “V” representing saline vehicle. Error bars are SEM