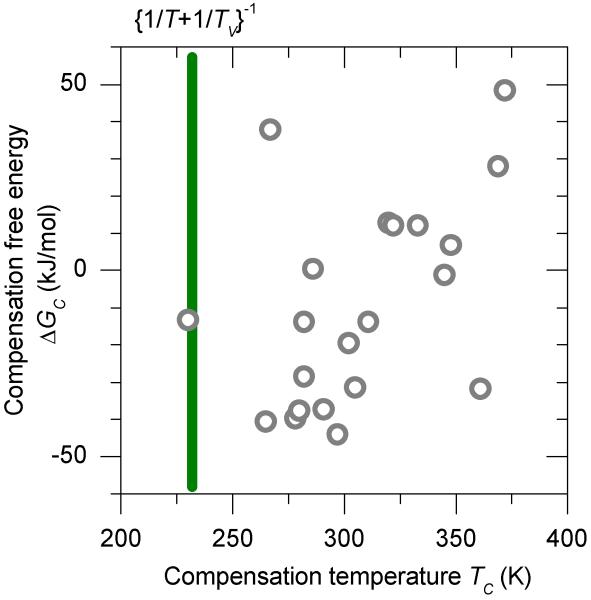
Figure 2.
Two-dimensional scatter plot of the compensation temperatures and Gibbs compensation free energies for some biomolecular systems in aqueous phase. See Table I for details. The vertical line at 235 K indicates the compensation temperature that is predicted from the properties of water, and neglecting the internal entropy and enthalpy changes of the macromolecule systems.

