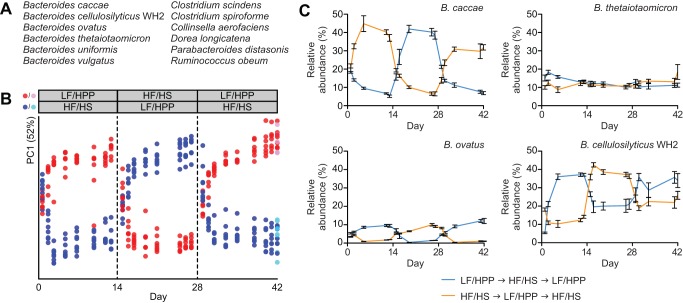
Figure 1. COPRO-Seq analysis of the structure of a 12-member artificial human gut microbial community as a function of diet and time.
(A) The 12 bacterial species comprising the artificial community. (B) Principal coordinates analysis (PCoA) was applied to relative abundance data generated by COPRO-Seq from two experiments (E1, E2), each spanning 6 wk. Following colonization (day 0), mice were switched between two different diets at 2-wk intervals as described in Figure S3. COPRO-Seq data from E1 and E2 were ordinated in the same multidimensional space. For clarity, only data from E2 are shown here (for the E1 PCoA plot, see Figure S5A). Red/blue, feces; pink/cyan, cecal contents. (C) Proportional abundance data from E1 illustrating the impact of diet on fecal levels of a diet-sensitive strain with higher representation on HF/HS chow (B. caccae), a diet-sensitive strain with higher representation on LF/HPP chow (B. ovatus), a diet-insensitive strain with no obvious diet preference (B. thetaiotaomicron), and a diet-sensitive strain with a preference for the LF/HPP diet that also achieves a high level of representation on the HF/HS diet (B. cellulosilyticus WH2). Mean values ± SEM are shown. Plots illustrating changes in abundance over time for all species in both experiments are provided in Figure S4C.

