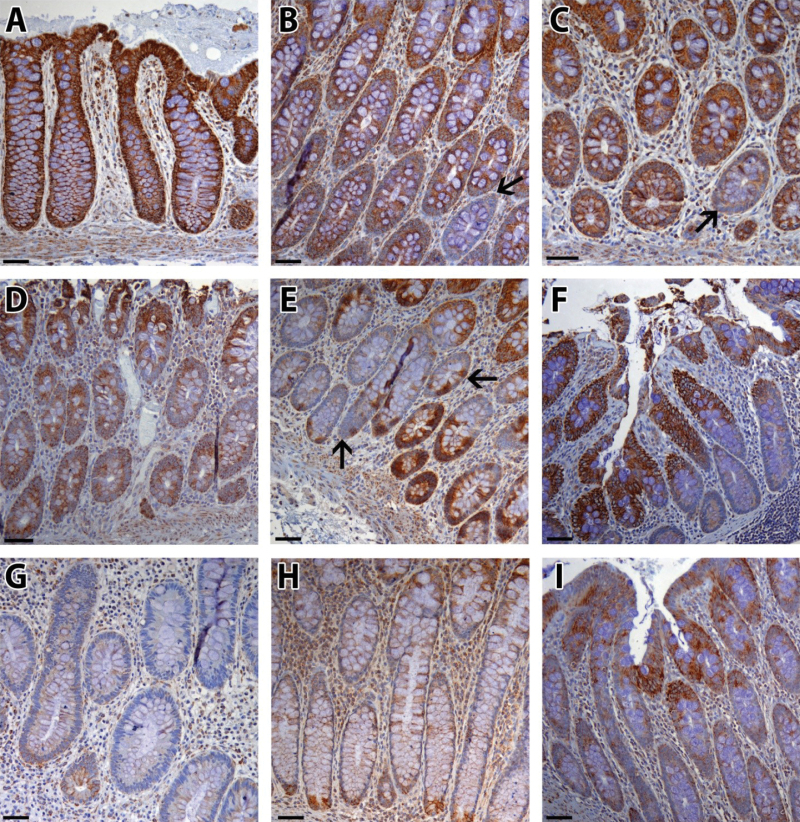
Figure 1.
Representative cytochrome C oxidase (COX) staining patterns. A–C) Normal colon. Black arrows in (B) and (C) indicate crypts with complete COX loss, consistent with previous findings in aging colon. D–F) Colon biopsies from ulcerative colitis (UC) nonprogressors. Black arrows in (C) show COX-positive cells alternating with COX-negative cells. G–I) Nondysplastic biopsies from UC progressors. Scale bar = 100 µm.

