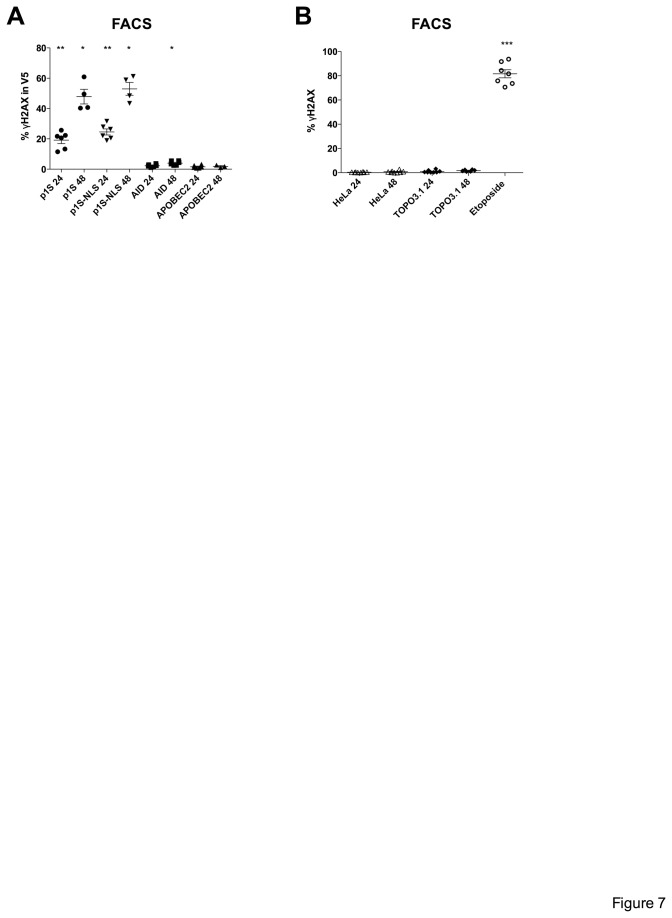
Figure 7. No induction of DSBs by AID expression.
(A) Results illustrating percentage of γH2AX in V5 expressing cells at 24 and 48 h post transfection. Group comparisons and differences to APOBEC2 at 24 and 48 h were calculated using the Mann-Whitney test (*p < 0.05; **p< 0.01). (B) Graph illustrates percentage of ©H2AX in cells at 24 and 48 h for transfections with TOPO3.1 empty vector control. Incubation for 16 h with 100 µM with DSBs inducing drug etoposide served as positive control. Dots are representative for independent experiments. Mean and SEM are shown. Group comparisons were calculated using the Kruskal-Wallis test (***p< 0.001).

