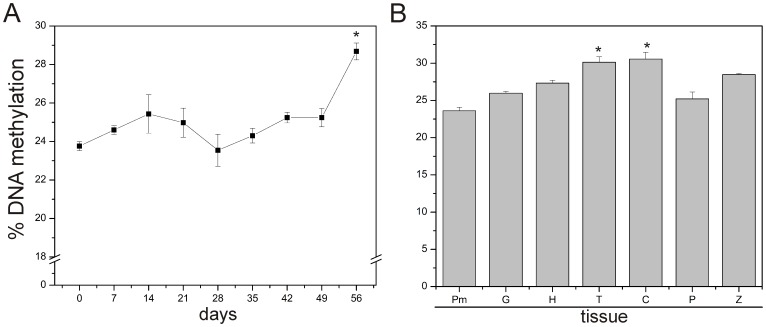
Figure 4. Global DNA methylation levels during somatic embryogenic induction and the separate embryogenic stages and tissues of Coffea canephora.
A) Percentage of global DNA methylation during the development of the somatic embryogenesis process in Coffea canephora shown in Figure 1. B) DNA methylation levels of different tissues and developmental somatic embryo stages. Pm: Proembryogenic mass, G: Globular stage, H: Heart stage, T: Torpedo stage, C: Cotyledonary stage, P: C. canephora in vitro plantlets, Z: C. canephora zygotic embryo in cotyledonary stage. Bars represent the mean ± SE (n = 3). An asterisk represents the statistical significance of mean differences at a given time by the Tukey test (P≤0.05). Each experiment was carried out three times.

