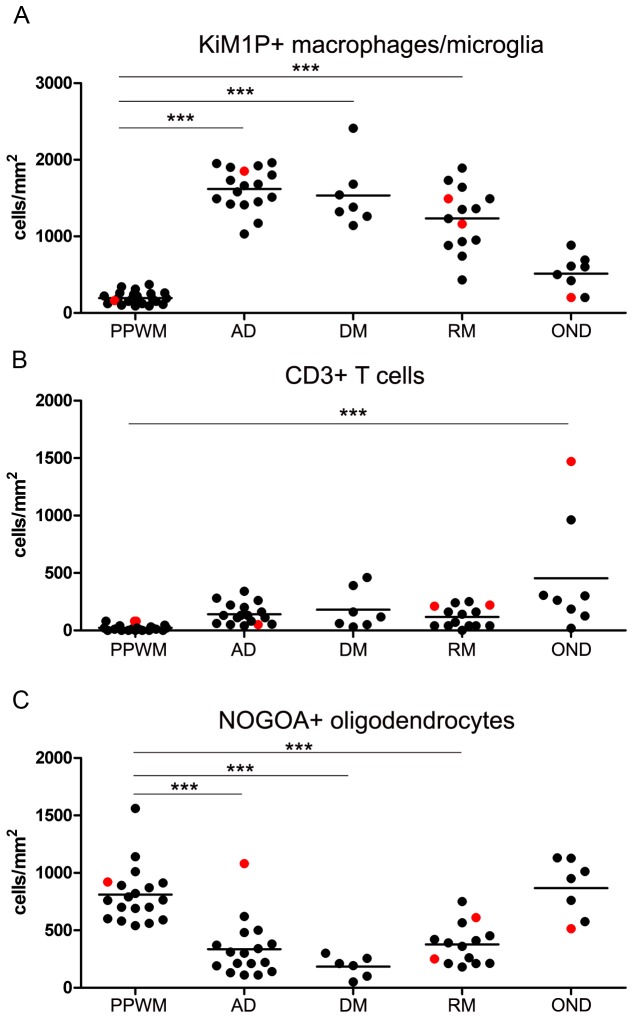
Figure 4. Quantification of macrophages/microglia, T cells, and oligodendrocytes in inflammatory demyelinating and non-demyelinating human CNS diseases.
Tissue samples from patients with early MS and non-demyelinating inflammatory diseases were stained for macrophages/microglia (anti-KiM1P), T cells (anti-CD3) and oligodendrocytes (anti-NOGOA). Numbers of macrophages/microglia were significantly increased in all lesion areas compared to PPWM (A). T cells were highest in patients with inflammatory, non-demyelinating CNS diseases (B). Oligodendrocytes were significantly decreased in all MS lesion areas (C). The red dots (A to C) indicate tissue samples with high numbers of TCF7L2 expressing cells (see Figure 5); however no obvious difference between these tissue samples and the others were observed with respect to macrophages, T cells and oligodendrocytes.
PPWM = periplaque white matter, AD = actively demyelinating, DM = demyelinated, RM = remyelinating/remyelinated, OND = other inflammatory neurological diseases.

