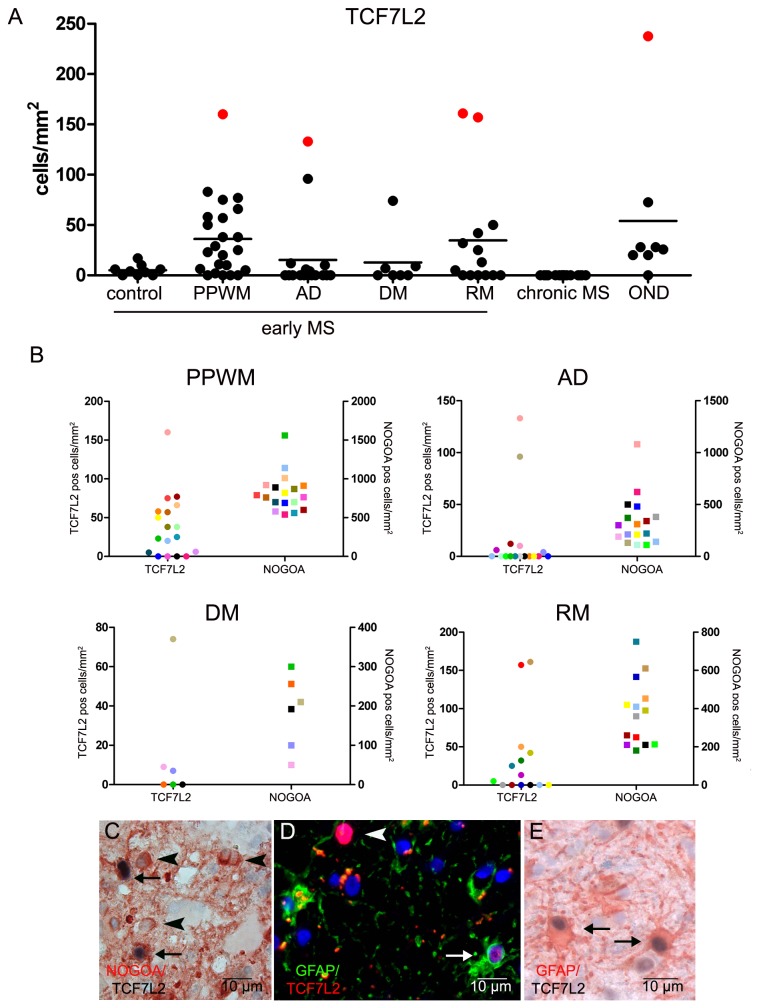
Figure 5. Expression of TCF7L2 in MS lesions and non-demyelinating inflammatory CNS diseases.
In a subset of early MS lesions increased numbers of TCF7L2 positive cells were detected in the periplaque white matter and in remyelinating lesion areas. However, also in other inflammatory neurological diseases (OND) TCF7L2 positive cells were present. Red dots indicate a subset of tissue samples with high numbers of TCF7L2 expressing cells (see Figure 4) (A). There was no correlation between numbers of TCF7L2 and NOGOA positive cells in the different MS lesion areas. NOGOA positive oligodendrocytes and TCF7L2 expressing cells were quantified in periplaque white matter (PPWM), actively demyelinating (AD), demyelinated (DM) and remyelinating (RM) lesion areas; TCF7L2 expressing cells (dots) and NOGOA expressing cells (squares) from the same lesion area are labelled in the same colour (B). Double stainings revealed that a subset of TCF7L2 positive cells were NOGOA positive oligodendrocytes (arrows). TCF7L2 negative oligodendrocytes are indicated by arrow heads (Double immunohistochemistry for NOGOA (red) and TCF7L2 (black) (C). In inflammatory non demyelinating disease TCF7L2 positive oligodendrocytes and astrocytes were detected (D and E). In D a GFAP and TCF7L2 positive astrocyte (arrow) as well as a GFAP negative TCF7L2 positive cell (arrow head) are depicted (double immunohistochemistry for GFAP (green) and TCF7L2 (red). Additional GFAP and TCF7L2 positive cells are shown in E (arrows) (double immunohistochemistry for GFAP (red) and TCF7L2 (black)).

