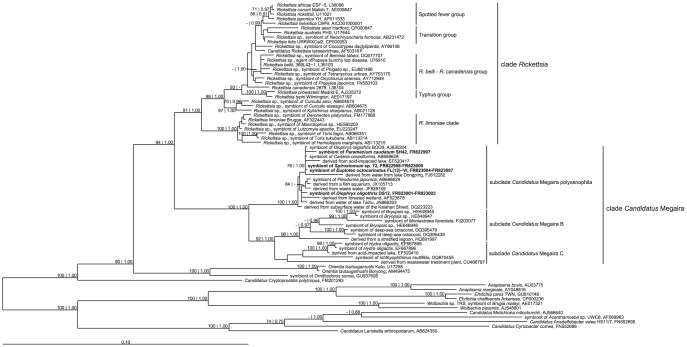
Figure 1. Maximum likelihood phylogenetic tree.
Numbers indicate bootstrap values inferred after 1,000 pseudoreplicates and Bayesian Posterior Probabilities (values below 70% respectively 0.7 are not shown). Sequences characterized in the present work are reported in bold. Scale bar: 10 nucleotide substitutions per 100 positions.

