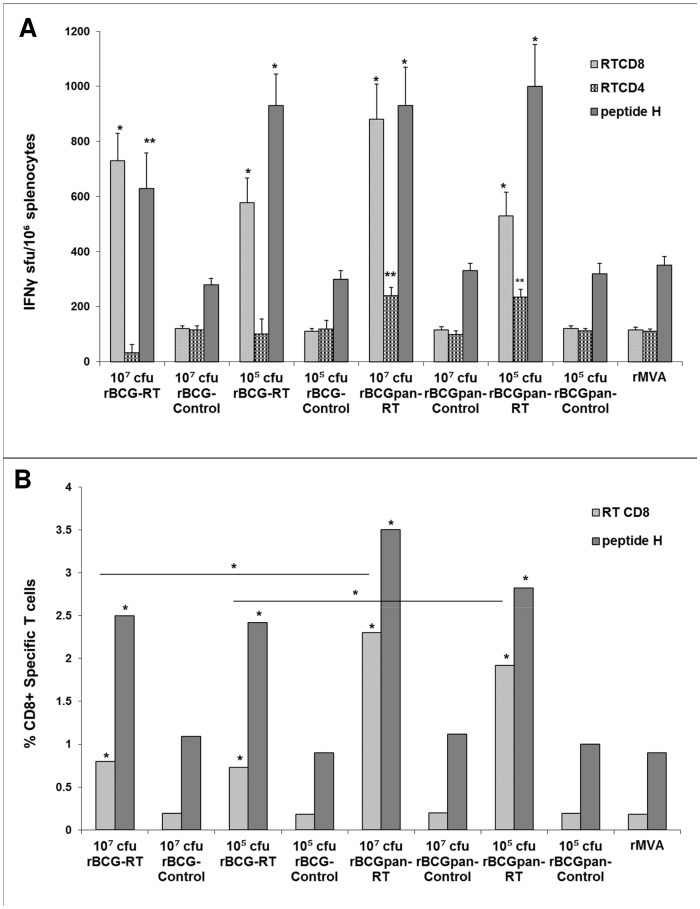
Figure 3. Influence of vector on IFN-γ ELISPOT responses to a rBCG-RT or rBCGpan-RT prime and rMVA boost.
Groups of mice were primed with the indicated rBCG vaccines (107 cfu or 105 cfu) then boosted with rMVA (104 pfu) on day 28. One group of mice was left unvaccinated then vaccinated on day 28 with rMVA. On day 40 spleens were harvested and splenocytes pooled from 5 mice per group. (A) IFN-γ ELISPOT assays with RT CD8+ T cell and CD4+ T cell peptides or peptide H CD8+ T cell peptide. Bars are the average and standard deviation of the average IFN-γ ELISPOT responses for the indicated individual peptides for 3 separate experiments. Asterisks indicate statistical significance of the mean IFN-γ ELISPOT responses for the individual peptides for a rBCG-RT or rBCGpan-RT vaccine prime and rMVA boost compared to that for the respective BCG- Control or rBCGpan-Control vaccine prime and rMVA boost. (B) Splenocytes were stained with H-2Kd and H-2Dd MHC class I pentamers folded with the RT CD8+ T cell peptide or peptide H CD8+ T cell peptide and flow cytometry was used to determine the frequency of RT- and peptide H-specific CD8+ T cells in the splenocyte population. Bars are the average of triplicate values for RT- and peptide H-specific CD8+ T cells expressed as a percentage of the total gated CD8+ T cell population for a single experiment. The coefficient of variation of all average values (standard deviation of the average expressed as a percentage of the average) was less than 0.01%. Asterisks indicate the statistical significance of the mean values for the percentage of CD8+ RT- or peptide H-specific T cells for a rBCG-RT or rBCGpan-RT vaccine prime and rMVA boost compared to that for the respective rBCG-Control or rBCGpan-Control vaccine prime and rMVA boost. Respective differences for peptide responses between groups are also indicated. *<0.01; **<0.05; Student's t-test for means of unpaired data.

