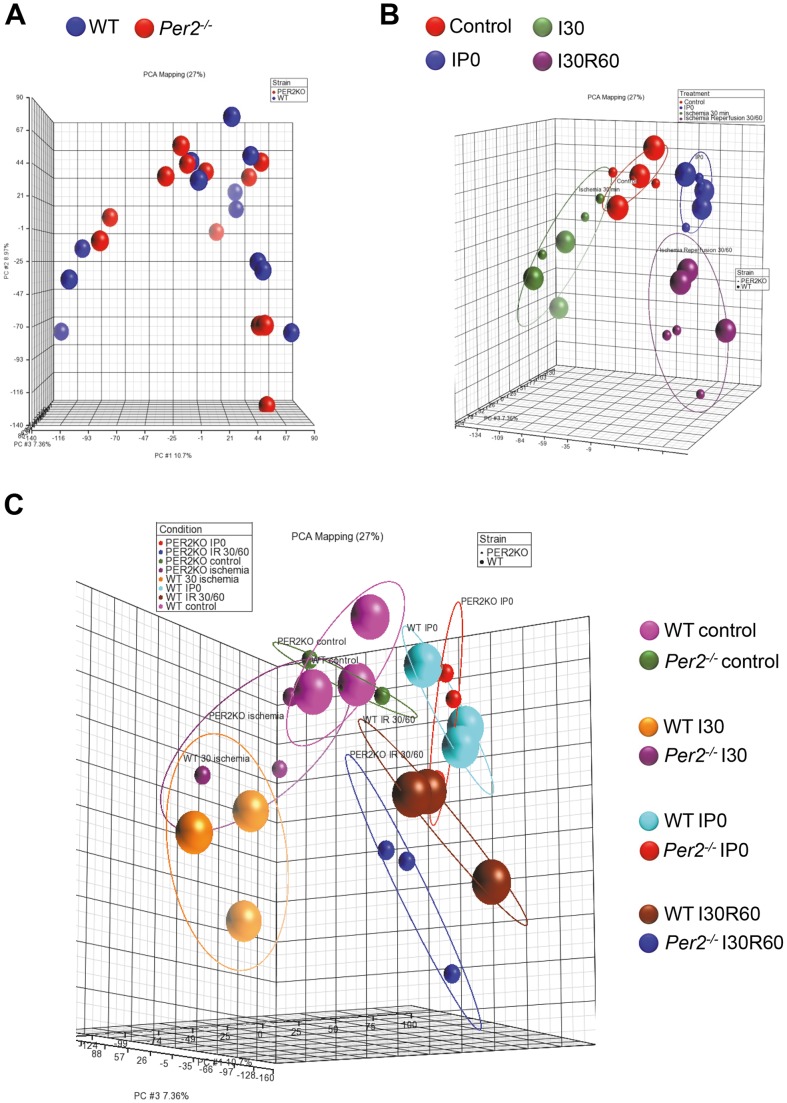
Figure 3. ‘Principal Components Analysis’ (PCA) of a 24 multi-plate microarray.
Each point represents a chip (sample) and corresponds to a row on the top-level spreadsheet. The color of the dot represents the type of the sample. Points that are close together within the plots have similar intensity values across the probe sets on the whole chip (genome), and points that are far apart within the plots are dissimilar. (A) PCA of the genetic background. (B, C) PCA of the different treatment conditions. WT = wildtype, Per2−/− = Period 2 deficient mice, I30 = 30 minutes of ischemia without reperfusion, IP0 = ischemic preconditioning (4×5 minutes of ischemia and reperfusion), I30R60 = 30 minutes of ischemia followed by 60 minutes of reperfusion. The units on the axes represent the different measurement points of all arrays where the percentage for one axis indicates how many of these measurement points are representable by this axis. NOTE: Due to the rotation of the 3-D graph using Partek Genomics Suite 6.6 not all values are visible.

