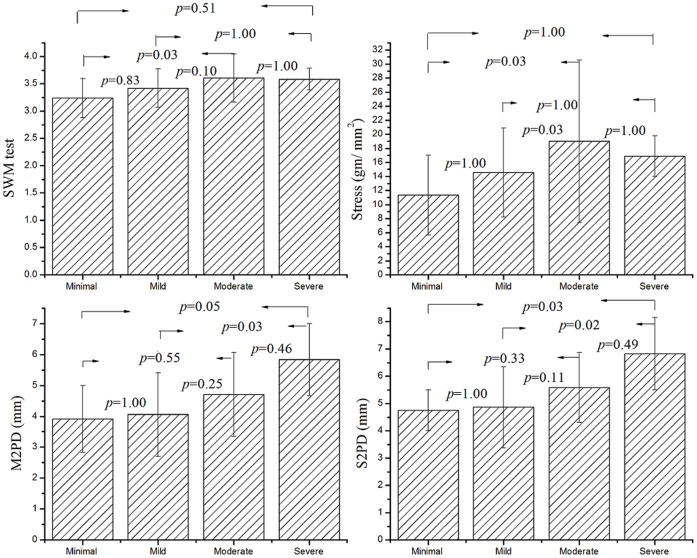
Figure 3. Mean (±SD) of SWM, M2PD, S2PD and stress determined from SWM result for various grades of CTS severity based on nerve conduction study.
The difference in all of the traditional sensibility tests between each pair of the CTS subgroups did not reach statistical significance. (Statistical analysis method: the mixed effect model with Bonferroni multiple comparisons test; the significance threshold analyses for Bonferroni post hoc test was set at p = 0.008.).

