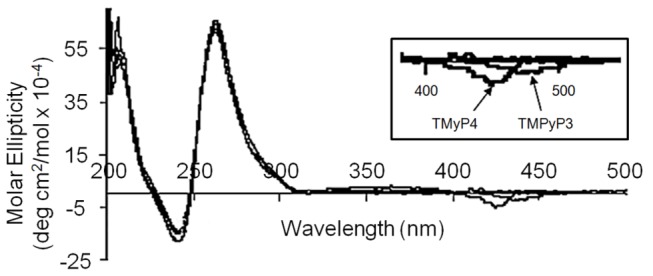
Figure 2. CD spectra for complex of the 39-mer Bcl-2 P1 promoter G-quadruplex saturated with bound TMPyP4, TMPyP3, or TMPyP2.

The inset shows an expanded view of the CD spectra in the range of the porphyrin absorption spectrum. The very small negative CD signals in the 400-450 nm range are only observed in the presence of excess porphyrin for TMPyP4 and TMPyP3.
