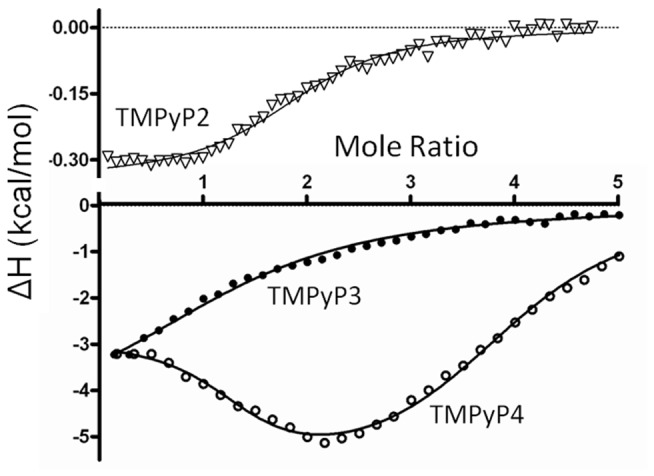
Figure 4. Typical ITC titration data (points) and nonlinear regression fits (solid lines) are shown for three titration experiments in which a dilute solution of porphyrin was added to a dilute solution of the annealed oligonucleotide in the calorimeter cell.

The upper panel represents data for the titration of 39-mer Bcl-2 with TMPyP2 (Note the Y-axis is scaled from 0 to .3 kcals/mol). The lower panel represents data for the titration of 39-mer Bcl-2 with TMPyP3 and TMPyP4. The best fit parameters for the non linear regression analysis of these ITC data are given in Table 1.
