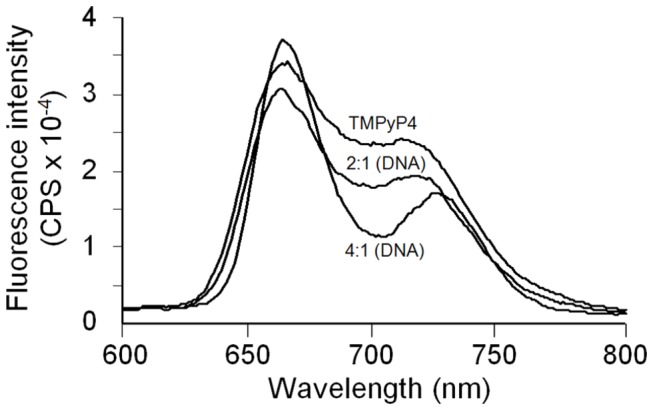
Figure 5. Fluorescence emission spectra obtained for the TMPyP4 in the presence or absence of 39-mer Bcl-2 G-quadruplex DNA.

Spectrum 1 labeled TMPyP4 is for the free porphyrin (in the absence of DNA). Spectrum 2 is for TMPyP4 in the (TMPyP4)2 · 39-mer Bcl-2 complex. Spectrum 3 is for TMPyP4 in the (TMPyP4)4 · 39-mer Bcl-2 complex.
