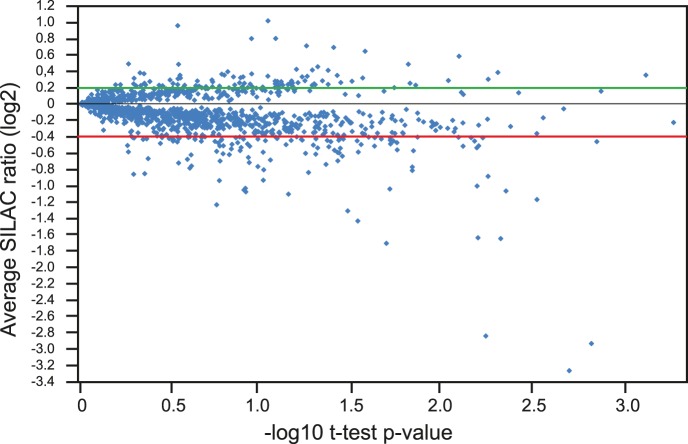
Figure 3. Changes in the proteome of salt-treated Arabidopsis seedlings.
Quantification of protein changes in response to 80 mM NaCl - the relative fold increase or decrease of all of the proteins analysed is indicated on the y axis expressed as the log2 of the average SILAC ratio across the five bioreps plotted against –log10 of the t-test p-value. For further analysis, up- and down-regulated proteins were taken as those outside the cut-off of 0.2 to −0.4.

