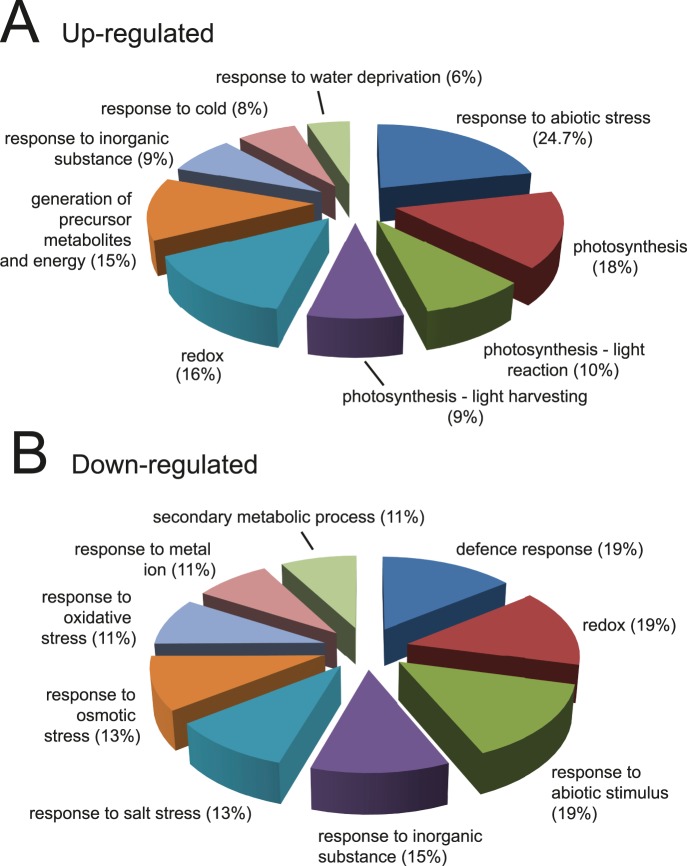
Figure 4. Distribution of up- and down-regulated proteins by biological process.
Gene ontology (GO) term enrichment distribution of up-regulated proteins (A) and down-regulated proteins (B) using DAVID. Frequency distribution (%) of proteins in significantly enriched (p<0.05) GO:Biological Process function terms are given (see also Table S4 and Table S5).

