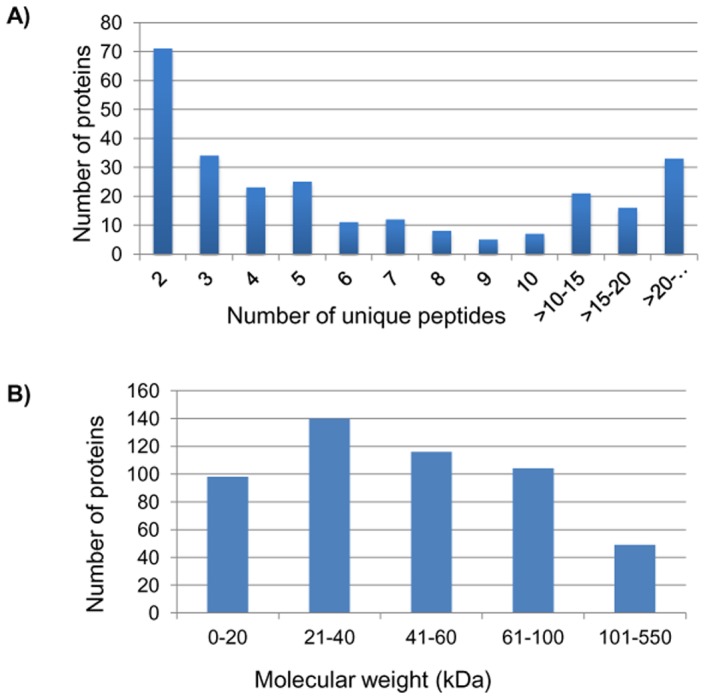
Figure 3. Histograms showing the number of proteins identified with unique peptides and molecular weight distribution of proteins identified in the study.

(A) Number of proteins identified based on 2 or more unique peptides. Approximately 70 proteins were identified with 2 peptides. Several proteins were identified with≥10 peptides. (B) Molecular Weight distribution of the identified proteins. Maximum number of proteins identified had molecular weights in the range 21–40 kDa.
