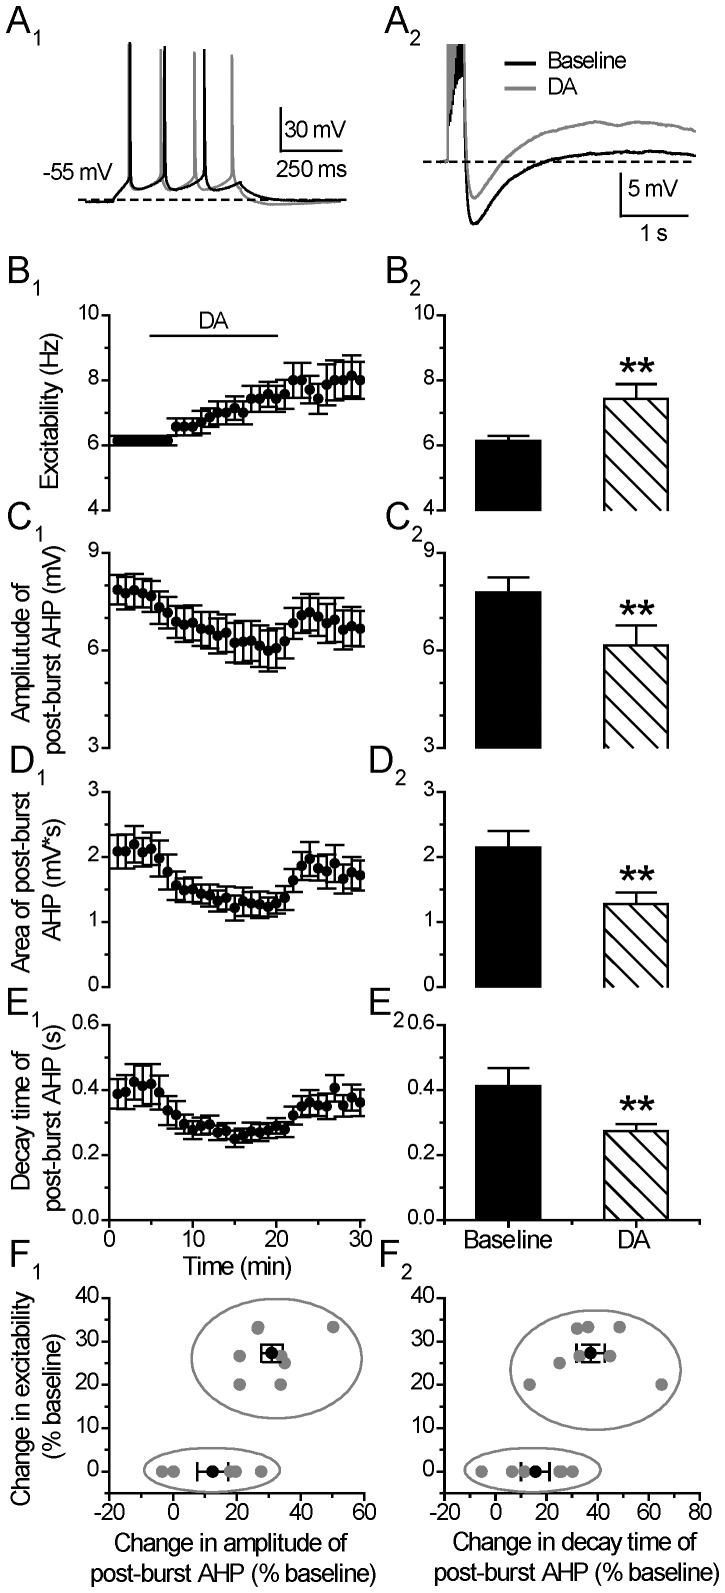
Figure 2. DA enhances neuronal neuronal excitability and suppresses post-burst AHP.
(A) An example of the effect of DA (30 µM) on neuronal excitability (left) and post-burst AHP (right). The protocols for excitability and post-burst AHP recording were run alternately every 30 seconds. (B) Excitability before, during and after 15-min application of the DA (left). Group histograms showing that DA enhances neuronal excitability of mPFC neurons (right) (**p<0.01 for DA vs. baseline, paired t-test). (C) Amplitude of post-burst AHP before, during and after 15-min application of the DA (left). Group histograms showing that DA suppresses the amplitude of post-burst AHP (right) (**p<0.01 for DA vs. baseline, paired t-test). (D) Area of post-burst AHP before, during and after 15-min application of the DA (left). Group histograms showing that DA reduces the area of post-burst AHP (right) (**p<0.01 for DA vs. baseline, paired t-test). (E) Decay time of post-burst AHP before, during and after a 15-min application of the DA (left). Group histograms showing that DA reduces the decay time of post-burst AHP (right) (**p<0.01 for DA vs. baseline, paired t-test). an increase in post-burst AHP. (F) Correlation plot showing two potential clusters of neurons with distinct response of excitability to the application of DA. Mean±SEM of the two groups were displayed as black symbols. In a few cells, the negative values in the X-axis mean an increase in post-burst AHP.

