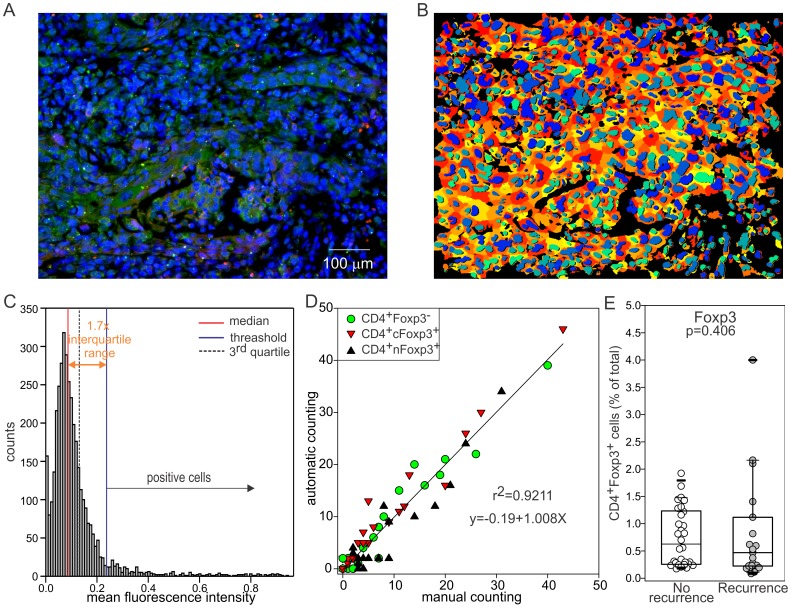
Figure 1. A computer assisted method for image quantification.
A) Immune fluorescence images 20X were taken on slides labeled with anti-CD4 (green) and anti-FOXP3 (red) antibodies and counterstained with DAPI for the nuclei. Images were segmented using Cellprofiler using the setting optimized to correctly segment lymphocytes as described in the material and methods. B) processedpicture showing the nuclei in a blue scale and the cytoplasm in red/yellow gradient. As shown in C), MFI values assume a “quasi” Gaussian distribution close to the 0. Empirically we found that a cell is considered positive by different investigators when its MFI is greater than a threshold (blue line) defined as: median (MFI)+1.7×(2XQ3-median). D) This method and this threshold were validated by counting CD4+Foxp3- (green circle), CD4+nFOXP3+ cells (black triangle) or CD4+cFOXP3+ (red triangle) cells in 20 pictures and by correlating those counts with the one obtained from the computer. The reported R2 and equation correspond to the interpolated line when all the 3 cell types are included in the analysis. When CD4+FOXP3-, CD4+cFOXP3+ or CD4+nFOXP3+ are counted the R2 values are 0.942, 0.956, and 0.890 respectively while the slope values are 0.983, 1.019, and 0.999 indicating a good correspondence between the “automatic” and the manual counting. E) CD4+FOXP3+ (regardless of the localization) were evaluated in recurrent or tumor free patients.

