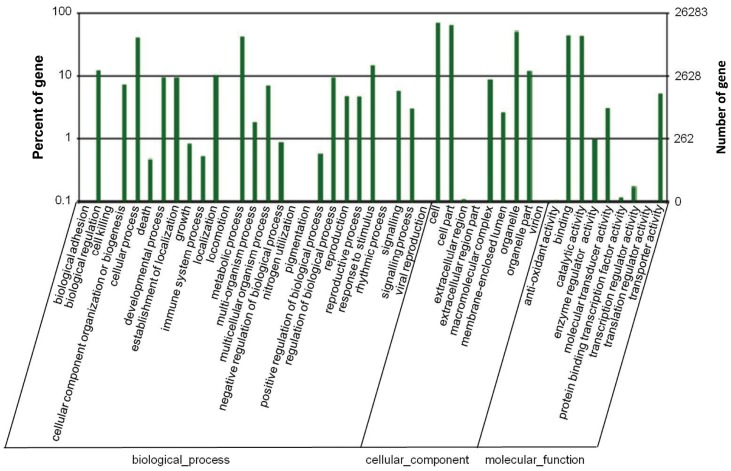
Figure 3. GO function analysis of unigenes from cotton embryo axis and cotyledon.
GO terms include “biological process”, “cellular component” and “molecular function”, of which, each was made up of different number of subclasses. The value from the right Y axis of ordinates shows the number of unigenes were classified into each subclass, and the percentage of the number of unigenes from each subclass in the total quantity of unigenes classified into the corresponding term was indicated by the value from the left Y axis of ordinates.

