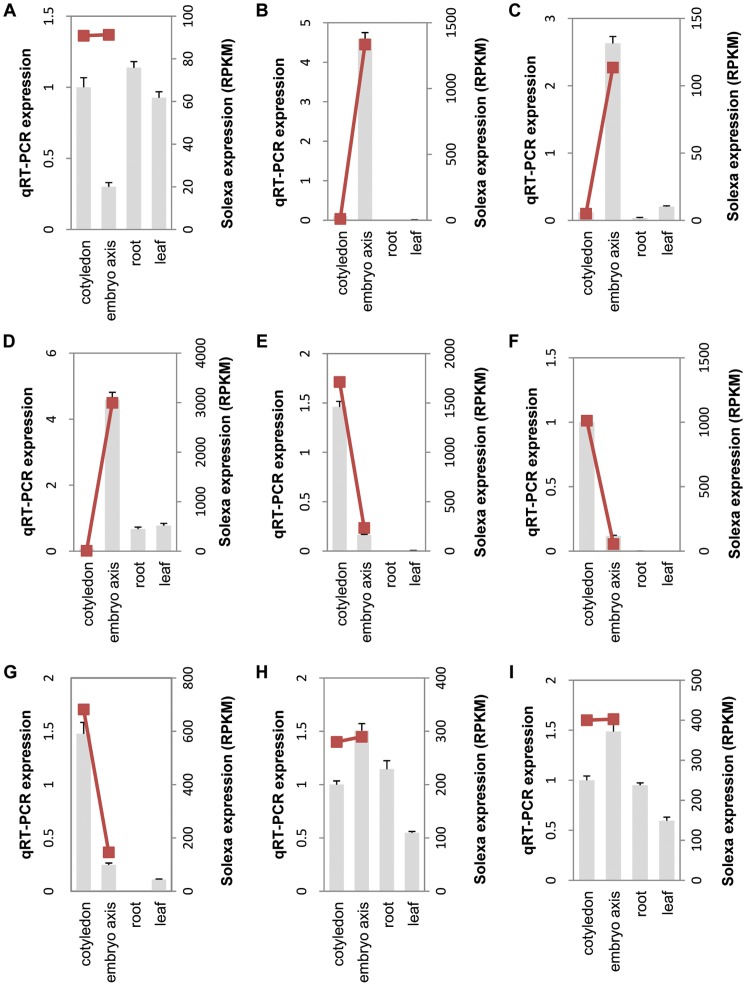
Figure 5. qRT-PCR validations of the selected unigenes.
9 unigenes were selected for qRT-PCR to validate the expression patterns in different samples. The grey bar represent the relative intensity of real time qRT-PCR from independent biological replicates (using the left Y axis), the red squares represent the expression level (RPKM) of the transcript (using the right Y axis) and are connected by the red trend lines. The unigenes are: A, unigene42855; B, unigene70917; C, unigene36175; D, unigene 72799; E, unigene4514; F, unigene37407; G, unigene25168; H, unigene29210 and I, unigene19199.

