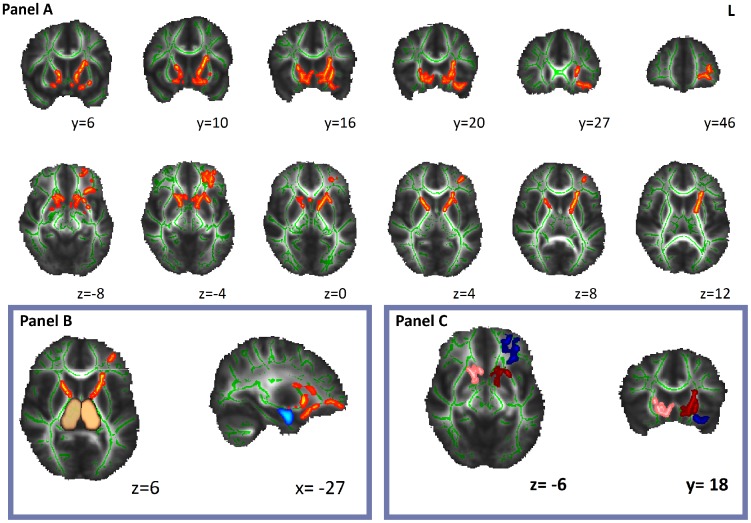
Figure 1. Panel A shows TBSS results with decreased anisotropy in psychopathic group as compared with normal controls (PFWE<0.05).
On an MNI brain (grayscale) the white matter skeleton is projected (green), as well as the location of significantly lower FA values in psychopaths as compared with normal controls (red-yellow). Amygdala (light-blue) and thalamic nuclei (copper) derived from Harvard-Oxford subcortical atlas (panel B). At the bottom right Cluster 1 (dark-red), Cluster 2 (dark-blue) and Cluster 3 (pink) are shown (panel C).

