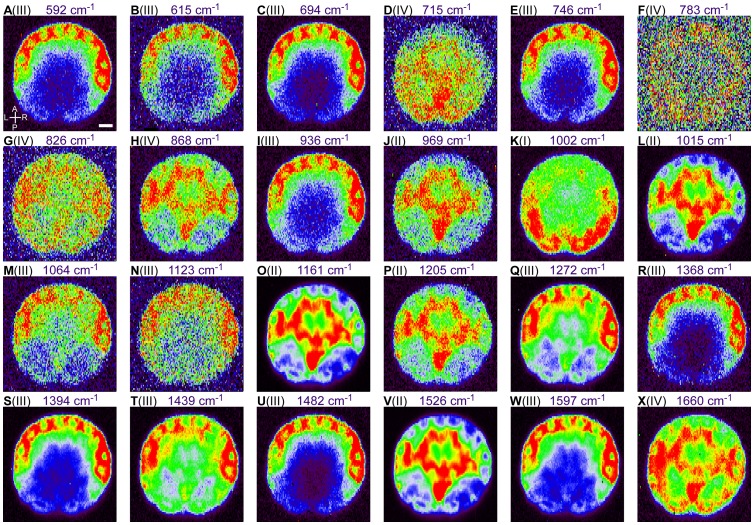
Figure 2. Raman maps generated from each individual Raman band of a 112-cell stage C. intestinalis embryo.
(A–X) Image panels displaying Raman maps of the 112-cell stage C. intestinalis embryo stained with CellMask in a rainbow scale with red representing the highest intensity and black representing the lowest. These maps were constructed based on the intensity of each individual Raman band indicated above. Maps were classified into four groups (I–IV) as described in the Results and Discussion. Roman numerals (I–IV) represent the group into which each Raman map was classified. Abbreviations: A, Anterior; P, Posterior; L, Left; R, Right. Scale bar: 20 μm.

