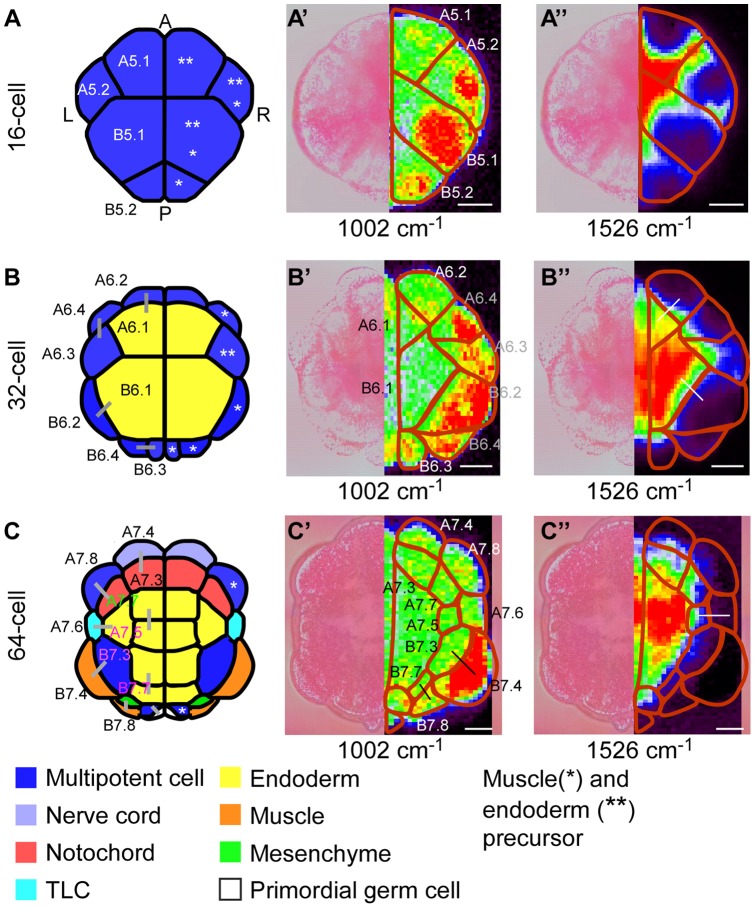
Figure 4. Localized distribution of Raman intensity during cell differentiation process.
Vegetal views of the embryo at each stage. 16-cell (A–A’’). 32-cell (B–B’’) and 64-cell (C–C’’). (A–C) Diagrams with cell lineage and fate information. Cell fates of each blastomere are indicated by different colors in the diagrams. Pairs of daughter cells are indicated by gray lines. (A’ –C’ and A’’ –C’’) Raman maps generated from the intensity of single Raman bands at 1002 (A’ –C’) and 1526 (A’’ –C’’) cm−1. Bright-field images (left) are represented with Raman maps (right). A portion of presumed cell border is indicated by red line. This cell border was determined from the bright-field images and Raman maps of group III. Daughter cell pairs in which, one daughter produced differentiated muscle (black line, C’)/endoderm (white line, B’’ and C’’) and another daughter produced other fate cells are indicated by each line within the embryo. Abbreviations: A, Anterior; L, Left; P, Posterior; R, Right; Scale bar. 20 μm.

