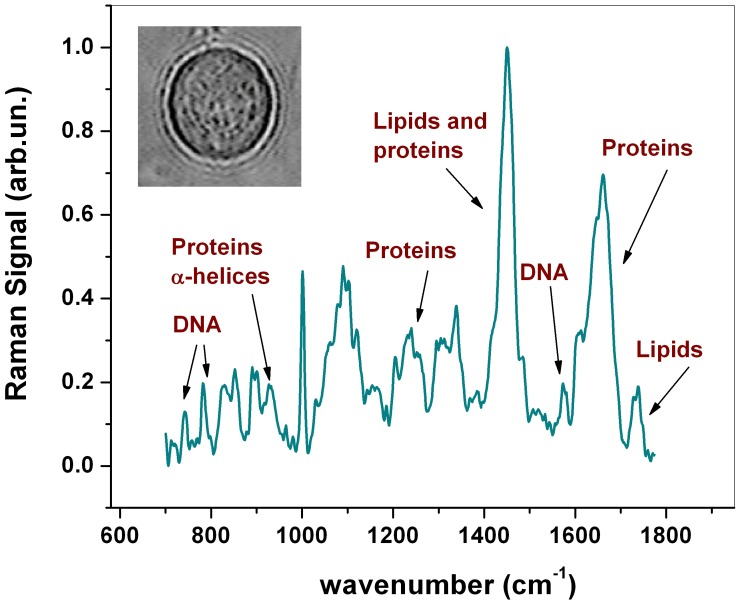
Figure 1. Raman spectrum from a live A.
Illustration of an average Raman spectrum in the 700–1800 cm−1 region from a live Acanthamoeba (cystic phase) obtained from 10 acquisitions at a randomly selected location inside the cell. Significant peaks and their relative assignments are labeled. The inset shows an optical image of the analysed A.

