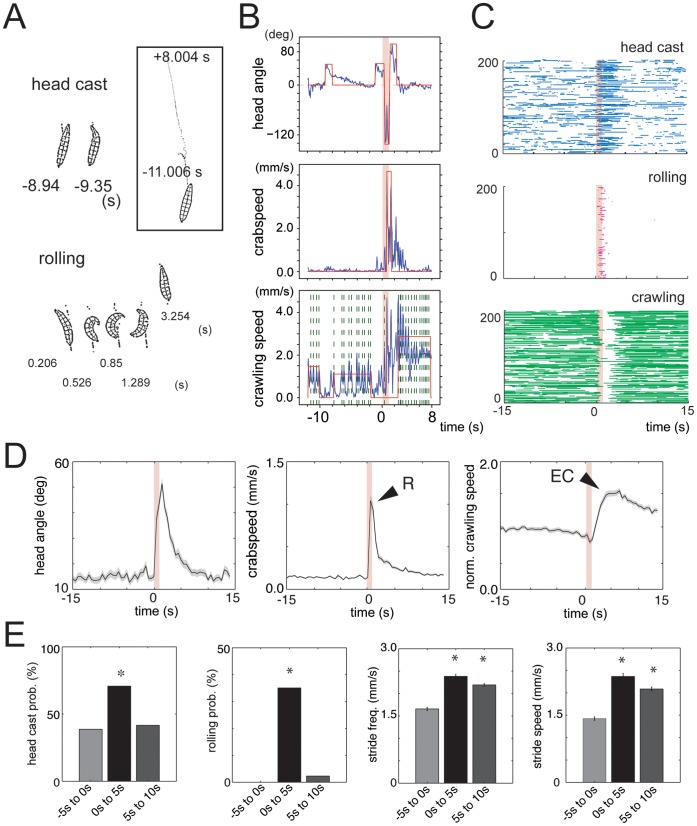
Figure 2. Noxious heat evokes rolling and escape crawling.
(A) Stills from a representative tracking movie of contours of larvae obtained with the MWT software. Top: example stills before the noxious stimulus onset (0 s) during which larva was crawling straight (−8.94 s) and head casting (−9.35 s). Bottom: example stills after stimulus onset during which larva was rolling (0.526, 0.85, 1.289 s) and then crawling straight again (3.254 s). Box: the path (x and y positions of the center of mass) taken by the same larva from −11.006 s before stimulus to +8.004 s after stimulus. (B) Graphs show head angle (top), crabspeed (middle) and crawling speed (bottom) of the larva shown in (A) as a function of time (blue lines) and casts (top), rolls (middle) and crawling runs (bottom) automatically detected by LARA (red lines). 808 nm laser stimulation came on at 0 s (1 s duration). The red line is zero if no action is detected and non-zero whenever the action is detected. For head casts, upward and downward deflections indicate leftward and rightward casts, respectively. Vertical green dashed lines in the bottom panel mark maxima in the speed function, which correspond to individual peristaltic crawling strides, automatically detected by LARA. Note how 808 nm light stimulus evoked a peak in crabpseed function (middle) detected as a rolling event and then a crawling run (bottom panel) with greater stride frequency and stride speed than the runs prior to stimulation. (C) Behavior raster plots show periods during which an individual larva was head casting or bending (top), rolling (middle) or crawling (bottom) during a time interval from 15 s prior to 15 s following stimulation. 808 nm laser stimulation came on at 0 s (1 s duration). Each row represents one larva tracked continuously throughout the interval (a total of 200 animals). (D and E) Reactions of wild-type Canton S larvae to noxious heat. (D) Graphs show head angle, crabspeed and normalized crawling speed as a function of time averaged across many animals from experiments in which wild-type Canton S larvae were presented with noxious heat stimuli at ambient temperature of 32°C. Dark lines, mean value. Light lines, ± s.e.m. N = 154. Pink lines at 0 s mark the stimulus onset and duration. R, roll. EC, escape crawl. Normalized crawling speed was computed from the absolute crawling speed by dividing the absolute crawling speed at each time point after stimulation with the mean value of crawling speed of that animal before stimulation. Graphs highlight the dynamics of the reactions to noxious heat. Following noxious heat stimulation there is first a peak in the crabspeed function, which corresponds to the roll (R), followed by a peak in the mean normalized speed function, that corresponds to the escape crawl (EC). Crabspeed peaks at 1 sec following stimulation. The speed of escape crawl is 50% higher than that of the baseline crawl prior to stimulation and it peaks at ca. 4 sec following stimulation. (E) Bar charts show head casting and rolling probability and the mean value of the maximum stride speed and stride frequency in a 5 s time window before stimulation (−5 s to 0 s) and in two consecutive 5 s time windows after stimulation (0 s to 5 s and 5 s to 10 s). Error bars indicate s.e.m. * p<0.001, for window(s) after stimulation compared to window before stimulation. Rolling probability is 0 (N = 189 larvae) prior to stimulation, but is significantly increased to 35% in the 5 sec window following stimulation (p<10−6, N = 154 larvae). The increase in mean speed following stimulation shown in Fig. 2D is in part due to a significant increase in peristaltic crawling stride frequency (p<10−6, N = 167 peristaltic crawling runs) and peristaltic crawling stride speed (p<10−6, N = 167 peristaltic crawling runs) in the windows following stimulation, relative to the 5 sec window prior to stimulation.

