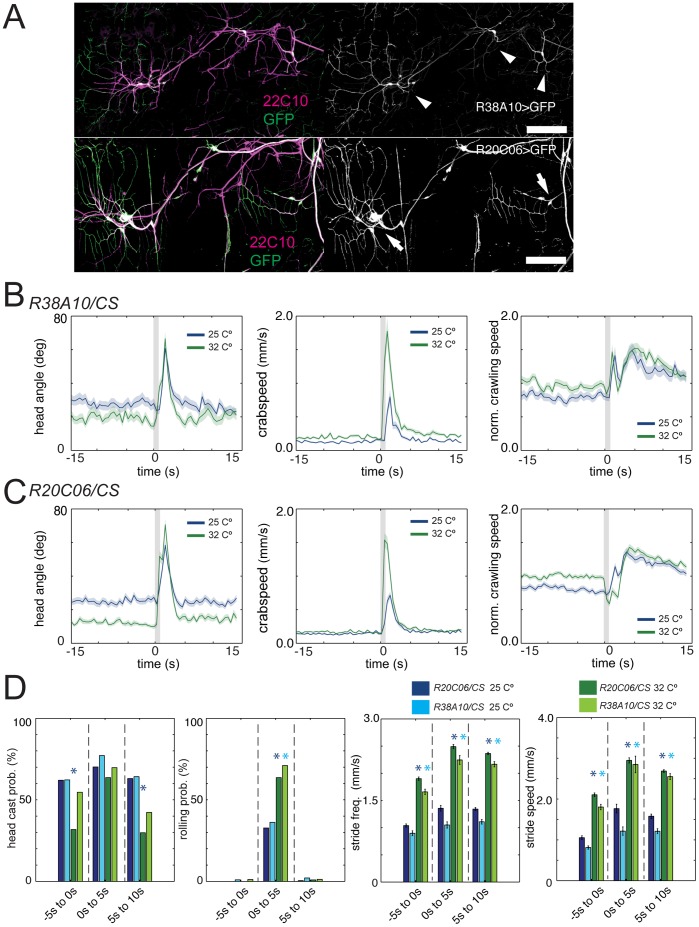
Figure 3. Noxious heat reactions are modulated by ambient temperature.
(A) Expression patterns of R38A10 and R20C06. Confocal microscope images of the A3 hemisegment of third instar R38A10>GFP and R20C06>GFP larvae. Larvae are co-immunostained with antibodies against GFP (green, left; white, right) and 22C10, a marker of all peripheral sensory neurons (magenta, left). Anterior is up. Dorsal midline is to the right. Scale bar represents 100 µm. R38A10 drives expression in class IV neurons (arrowheads) and R20C06 in class I md neurons (arrows) (compare to the reference images in Grueber et al. 2002 [54]). (B and C) Graphs show head angle, crabspeed and normalized crawling speed as a function of time as in Fig. 2D. Dark lines, mean value. Light lines, ± s.e.m. Grey lines at 0 s mark the stimulus onset and duration. Data from control R38A10>Canton S and R20C06>Canton S at 32°C (green, N = 91 and 102, respectively) and 25°C (blue, N = 98 and 184, respectively) is compared. The increase in the mean crabspeed function following stimulation (corresponding to the roll) is present under both conditions, but it is both faster and larger at 32°C compared to 25°C. Escape crawl looks similar under both conditions (the increase in mean speed in response to noxious stimulation, relative to mean speed prior to stimulation), although the absolute crawling speed is drastically different (see below). (D) Bar charts show head casting and rolling probability and the mean value of the maximum stride frequency and stride speed as in Fig. 2E. Error bars indicate s.e.m. * (light blue star) and * (dark blue star), p<0.001 for R38A10>Canton S and R20C06>Canton S, respectively, when behavior at 32°C is compared to 25°C in the same time window. Rolling probability of R38A10>Canton S (light green) and R20C06>Canton S (dark green) is drastically increased at 32°C compared to 25°C (light blue and dark blue) (from 36% and 32% to 71% and 63.6%, N = 105, 171, 76, 55; p = 0.000063 and 0.000846). Likewise, stride frequency and stride speed are significantly increased at 32°C compared to 25°C, both prior to stimulation and following stimulation (see Table S1 for further details).

