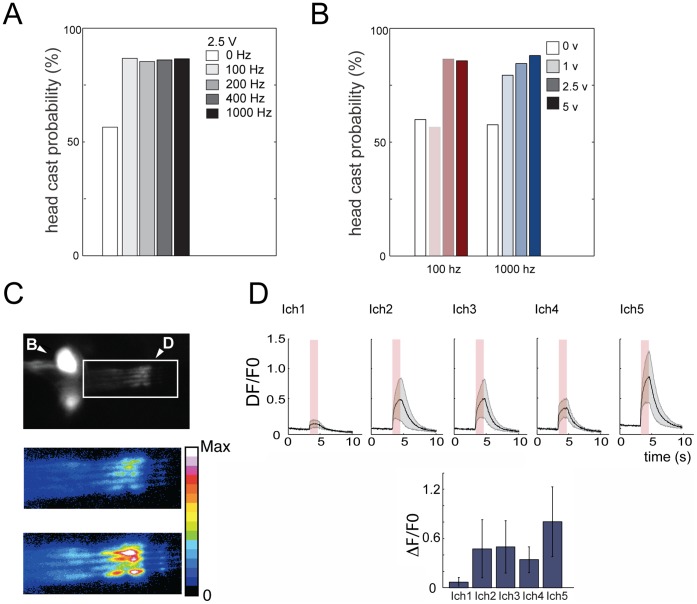
Figure 6. Vibration evokes head-casting and is sensed by chordotonal neurons.
(A and B) Larval reaction to a range of vibration frequencies and intensities. Bar charts show head cast probability in a 5 s time window following vibration onset compared to a 5 s time window in the absence of vibration (0 Hz and 0 V, white bar). (A) Larvae significantly increase head cast probability compared to the baseline prior stimulation, in response to a range of frequencies from 100 Hz to 1000 Hz. N equals 92, 76, 104, 100 and 111 for 0 Hz, 100 Hz, 200 Hz, 400 Hz and 1000 Hz. p<10−6, for 0 Hz, compared to 100 Hz, 200 Hz, 400 Hz and 1000 Hz, respectively. (B) Head cast probability increases as voltage applied to the speaker increases, at 100 Hz and at 1,000 Hz, reaching the peak reaction of about 90%. N equals 67, 63, 76, 84, 105, 112, 111 and 105, respectively. p<10−6, for 100 Hz, 2.5 V and 5 V compared to 0 V and for 1000 Hz, 1 V, 2.5 V and 5 V, compared to 0 V. (C and D) Larval lateral ch (lch1-5) neurons sense 1000 Hz vibration. (C) An image of Ca2+ signals visualized with GCaMP3 in the dendrites (inside white rectangle) of lch1-5 in one abdominal hemisegment (A4), before stimulation (top and middle) and during a 1000 Hz, 2 V tone (1 sec after stimulus onset) (bottom). B, cell body cluster of lch1-5. D, dendrites of lch1-5. Anterior is up. Dorsal midline is to the right. Color code (middle and bottom panels), pseudocolored fluorescence intensity levels using the Fiji 16 color code [34]. White and black, highest and lowest intensity, respectively. (D) Quantification of GCaMP responses in the five individual members of the lch1-5 cluster in A4. Graphs show mean ΔF/F0 in the dendrite of each ch neuron. Error bar represent s.e.m. N = 4 larvae. Different members of the lch1-5 cluster have differential sensitivity to 1000 Hz, the most sensitive being lch5, lch2, lch3 and lch4, and least sensitive lch1.

