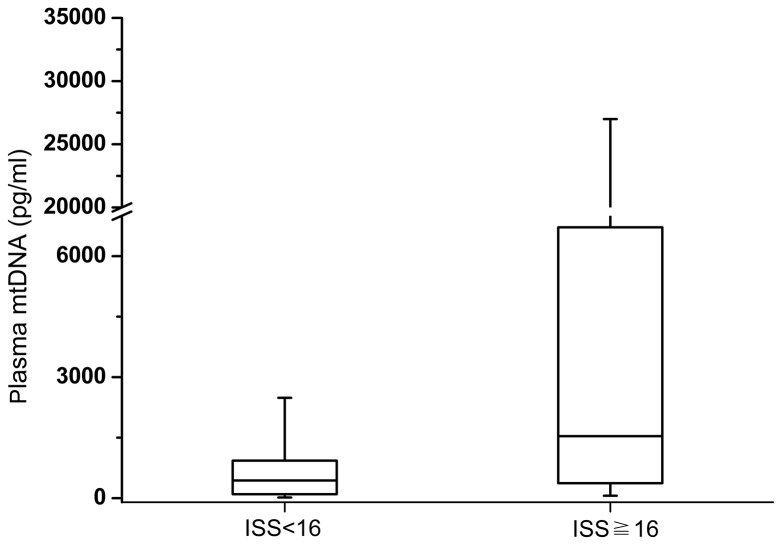
Figure 3. Box plots of plasma mitochondrial DNA concentration in trauma patients stratified by the severity of injury.
Plasma mtDNA concentrations presented as median values (line across the boxes), IQR (limits of the boxes), and 5th to 95th percentiles (whiskers). Plasma mtDNA concentrations in traumatic patients with ISS ≧ 16 were significantly higher than in patients with ISS < 16 (P<0.001).

