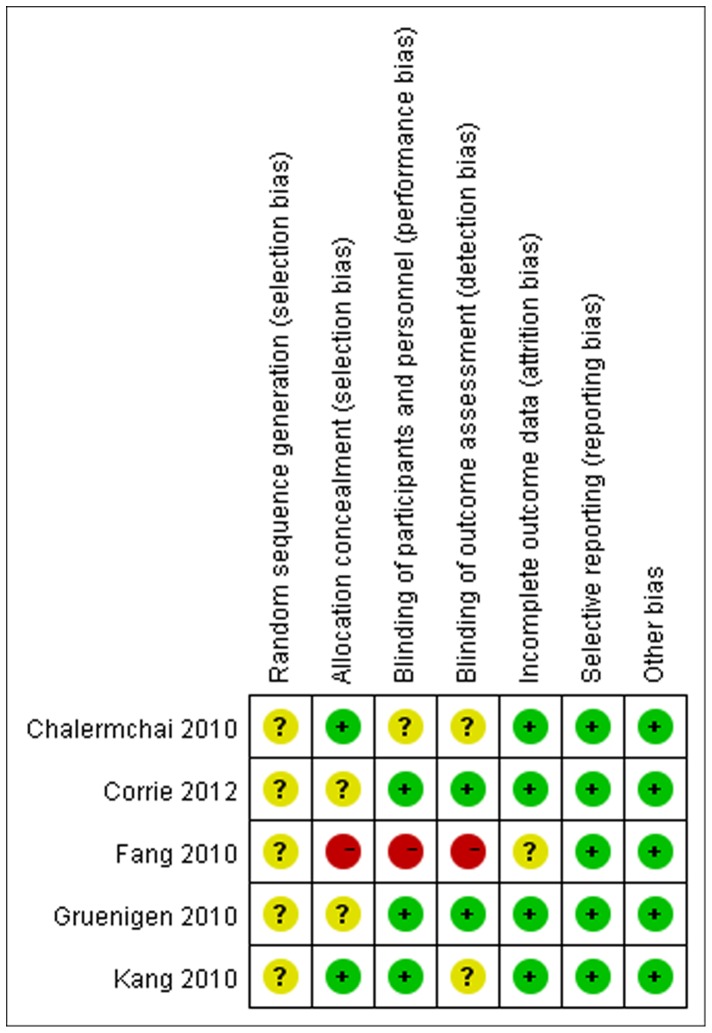
Figure 2. Quality assessment in included studies.
This plot is created by the software of RevMan 5.1.0. It illustrates the quality of included studies with each of the judgement (‘low risk’, ‘high risk’ or ‘unclear risk’ of bias). All studies had low risk bias in selective reporting and other issues, and unclear risk in random sequence generation. One study (Fang 2010) had high risk bias in allocation concealment and blinding.

