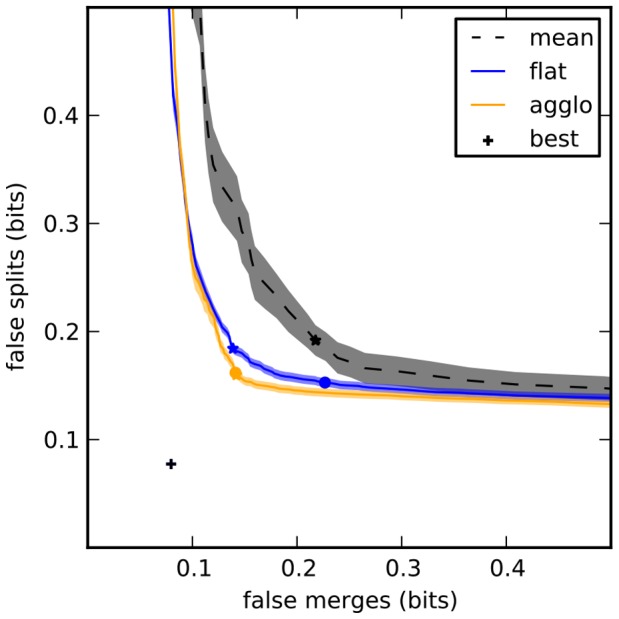
Figure 4. Split VI plot for different learning or agglomeration methods.

Shaded areas correspond to mean  standard error of the mean. “Best” segmentation is given by optimal agglomeration of superpixels by comparing to the gold standard segmentation. This point is not
  because the superpixel boundaries do not exactly correspond to those used to generate the gold standard. The standard deviation of this point (
 ) is smaller than the marker denoting it. Stars mark minimum VI (sum of false splits and false merges), circles mark VI at threshold 0.5.
