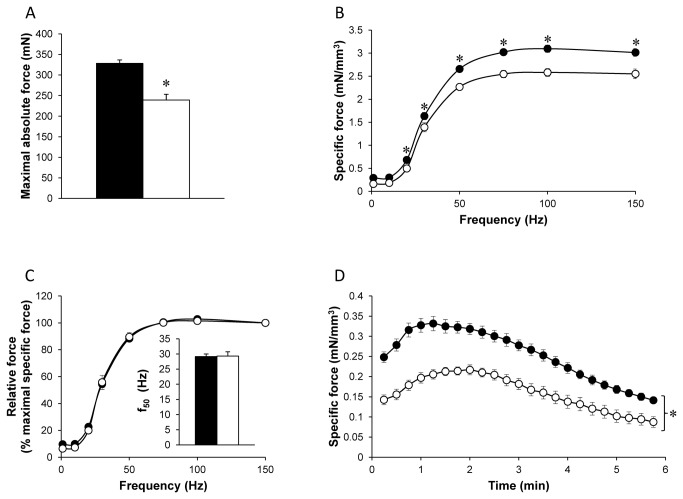
Figure 2. Absolute maximal force production (A), specific (B) and relative (C) force production during the force-frequency protocol and specific force production during the stimulation protocol (D) in WT group (•) and Tg(ACTA1)Asp286Gly group (○).
Force was normalized to hindlimb muscles volume (B, D) and to maximal force obtained at 150 Hz (C). f50 (inset Figure C) represents the frequency resulting in half the maximal force production. Absolute (A) and specific force production (B & D) were lower in Tg(ACTA1)Asp286Gly group as compared to the WT group. On the contrary, no difference was observed for f50 between the two groups. Values are presented as the mean ± SEM. Significantly different between groups * P < 0.05.

