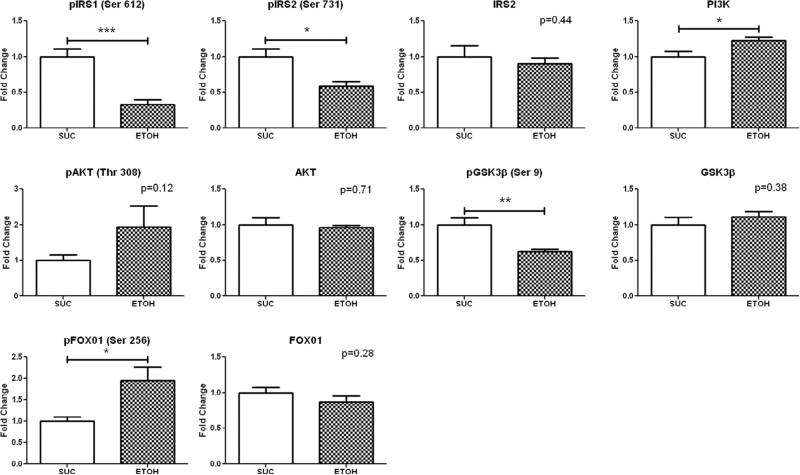
Figure 2. Insulin Signaling Protein Expression in the Ischemic Territory.
Levels represent fold change ± standard error of the mean compared to SUC. Western blot analysis demonstrated that alcohol consumption significantly up-regulated expression of PI3K and pFOX01 (Ser 256), and down-regulated expression of pIRS1 (Ser 612), pIRS2 (Ser 731) and pGSK3β (Ser 9) compared to SUC. *p<0.05 **p<0.01 ***p<0.001

