
Figure 2.
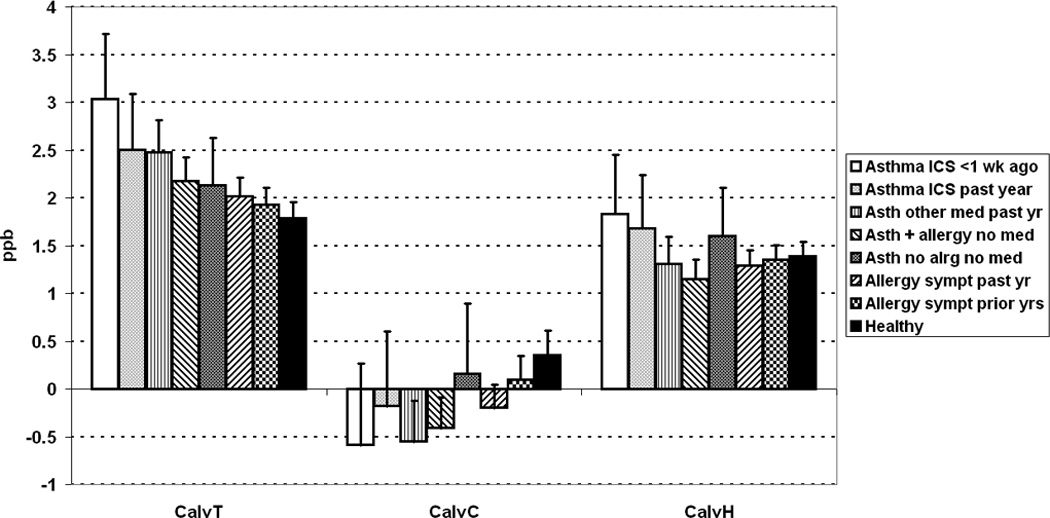
CalvNO differences by respiratory health status, as determined by extended NO models of Tsoukias (CalvT), Condorelli (CalvC), and Hogman (CalvH), for entire population with technically acceptable data. Bar indicates geometric mean; flag indicates upper 95% confidence limit of geometric mean. Significance of differences: P < 0.0001 for CalvT and CalvC, P = 0.12 for CalvH.