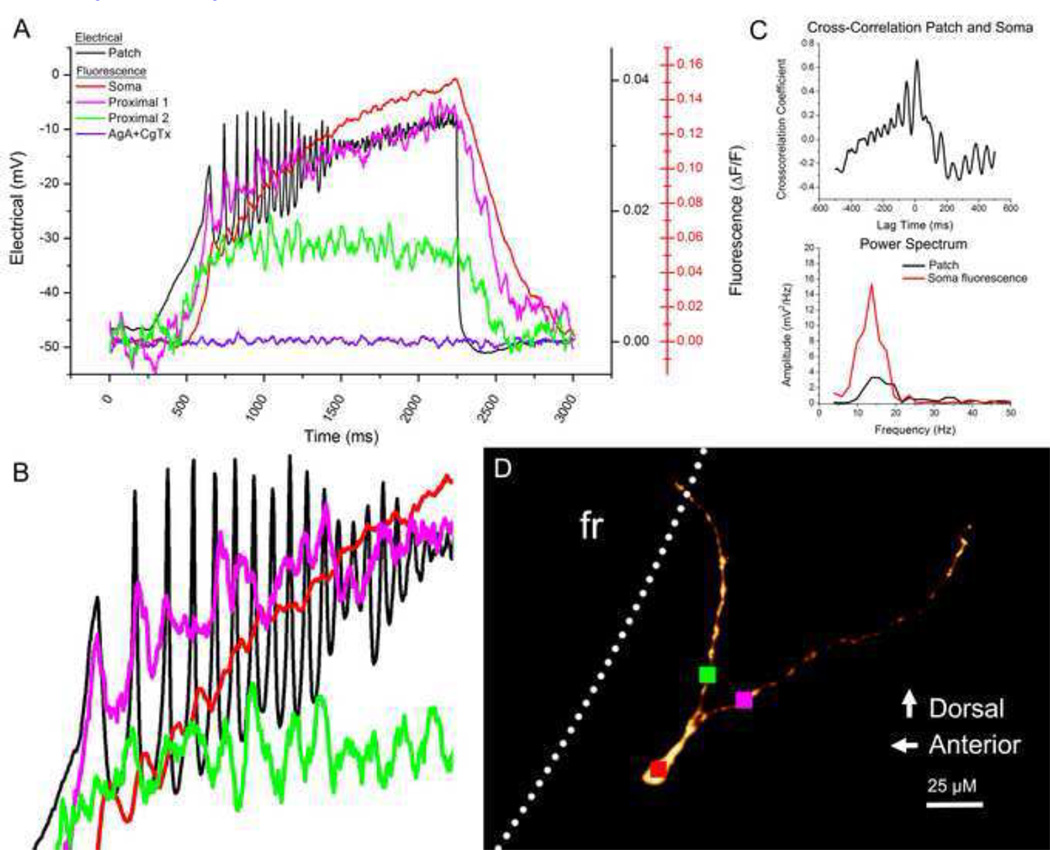
Fig. 5.
Oscillations present in the electrical patch-recorded signal were also evident in the recorded calcium signal. A. Overlay of the electrical patch signal (black record) with the somatic calcium signal (red record) and calcium recordings from two dendritic branches (pink and green, sampling locations shown in D). The somatic calcium signal after AgA and CgTx application is shown in red. Note that the somatic calcium signal uses a different y-axis scaling (red). B. Zoom of the oscillation signal in A. A slight time delay (~10msec and decreasing) is present in the somatic signal. Some oscillations were present in dendritic signals that matched the electrical signal while others were slightly out of phase. C. Cross-correlation graph and power spectra of the patch recording (black) and the somatic fluorescence recording (red). D. Confocal image of the recorded cell indicating fluorescence sampling locations (red, pink and green squares)

