Fig. 7.
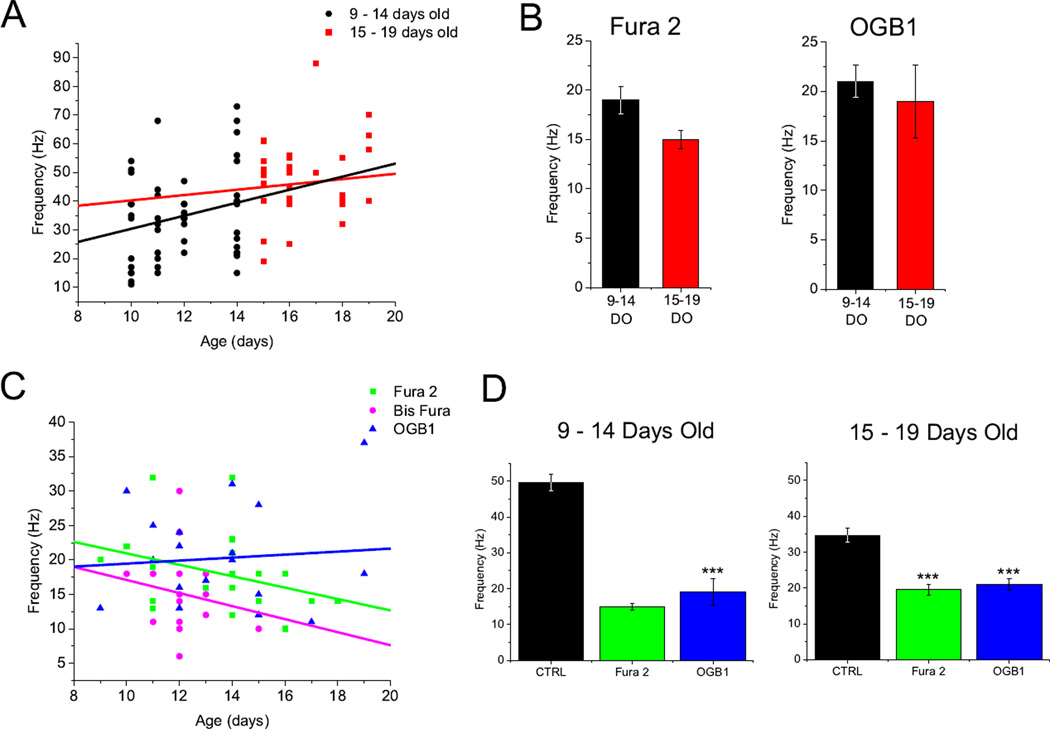
Calcium dyes slowed the peak oscillation frequency in cells and confounded age dependent frequency increases. A. Scatter plot of the peak oscillation frequency of each control cell from 9– 19 days old (DO). Cells were sub-divided into 9–14 DO (black) and 15–19 DO (red). Linear regression fits for each group (9–14 DO R2=0.24; 15–19 DO R2=0.08). B. Bar graph showing average peak frequency for Fura 2 and OGB1 cells divided into 9–14 DO and 15–19 DO age groups (Fura 2 9 −14 DO 19±1.4 Hz; 15 – 19 DO 15±0.94 Hz, P>0.05; OGB1 9 −14 DO 21±1.7 Hz; 15 – 19 DO 19±3.7 Hz, P>0.05). Bis Fura was not compared. C. Scatter plot showing the peak oscillation frequency for each individual cell from 9–19 DO. Straight lines correspond to linear regression fits of each dye group (Fura 2 R2 = −0.34; Bis Fura R2=−0.2; OGB1 R2=0.08). D. Bar graph comparing average peak frequency of Fura 2 and OGB1 dye groups to control cells of equivalent age. Both dye groups showed significantly lower frequencies regardless of age (CTRL 9-14DO 34.6±2.1; Fura 2 vs. CTRL, P< 0.001; OGB1 vs. CTRL, P< 0.001; CTRL 15–19DO 49.5±2.4; Fura 2 vs. CTRL, P< 0.001; OGB1 vs. CTRL, P< 0.001)

