
Figure 1.
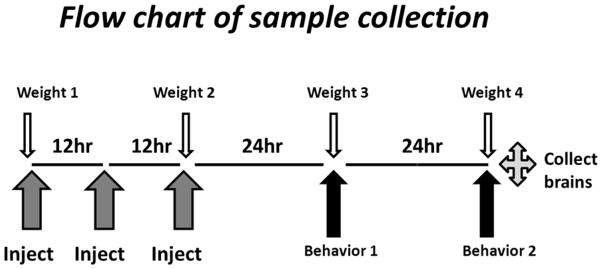
Flow chart of the experimental design. Upward arrows designate drug injections, and behavioral experiments, as indicated. Downward arrows indicate the time points for weighing mice. After 72 h, mice were sacrificed, and neural cells isolated and analyzed as described in Methods.